. 2022 Aug 15;10(1):127.
doi: 10.1186/s40168-022-01319-7.

Systematic profiling of the chicken gut microbiome reveals dietary supplementation with antibiotics alters expression of multiple microbial pathways with minimal impact on community structure

Affiliations

Systematic profiling of the chicken gut microbiome reveals dietary supplementation with antibiotics alters expression of multiple microbial pathways with minimal impact on community structure

Angela Zou et al. Microbiome. .

Abstract

Background: The emergence of antimicrobial resistance is a major threat to global health and has placed pressure on the livestock industry to eliminate the use of antibiotic growth promotants (AGPs) as feed additives. To mitigate their removal, efficacious alternatives are required. AGPs are thought to operate through modulating the gut microbiome to limit opportunities for colonization by pathogens, increase nutrient utilization, and reduce inflammation. However, little is known concerning the underlying mechanisms. Previous studies investigating the effects of AGPs on the poultry gut microbiome have largely focused on 16S rDNA surveys based on a single gastrointestinal (GI) site, diet, and/or timepoint, resulting in an inconsistent view of their impact on community composition.

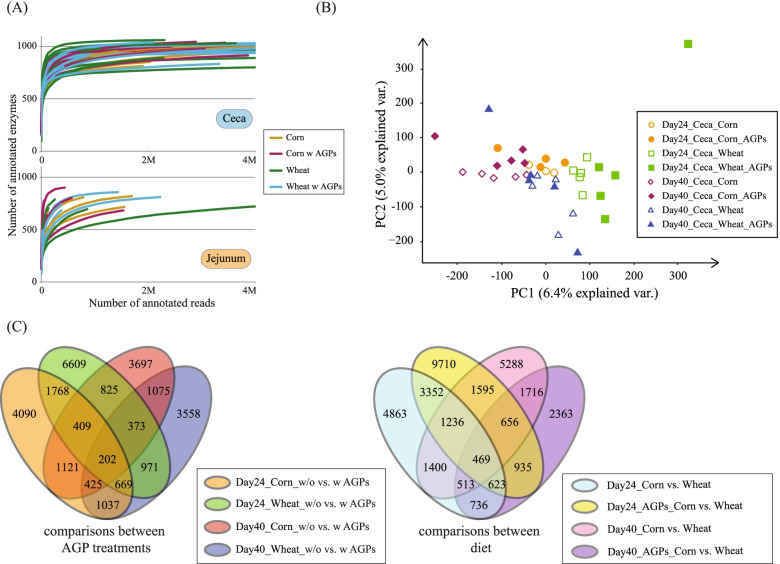
Methods: In this study, we perform a systematic investigation of both the composition and function of the chicken gut microbiome, in response to AGPs. Birds were raised under two different diets and AGP treatments, and 16S rDNA surveys applied to six GI sites sampled at three key timepoints of the poultry life cycle. Functional investigations were performed through metatranscriptomics analyses and metabolomics.

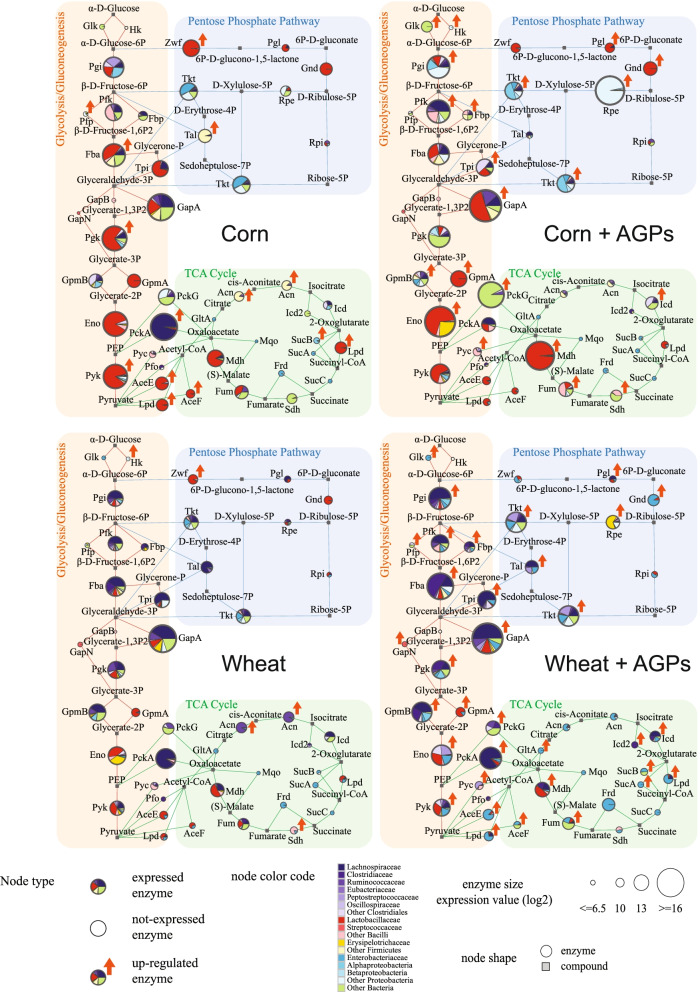
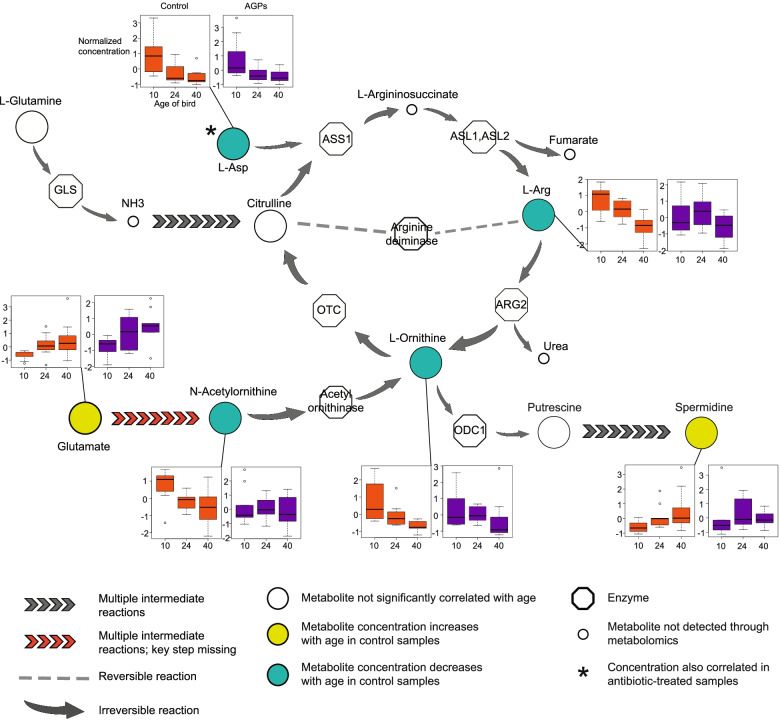
Results: Our study reveals a more nuanced view of the impact of AGPs, dependent on age of bird, diet, and intestinal site sampled. Although AGPs have a limited impact on taxonomic abundances, they do appear to redefine influential taxa that may promote the exclusion of other taxa. Microbiome expression profiles further reveal a complex landscape in both the expression and taxonomic representation of multiple pathways including cell wall biogenesis, antimicrobial resistance, and several involved in energy, amino acid, and nucleotide metabolism. Many AGP-induced changes in metabolic enzyme expression likely serve to redirect metabolic flux with the potential to regulate bacterial growth or produce metabolites that impact the host.

Conclusions: As alternative feed additives are developed to mimic the action of AGPs, our study highlights the need to ensure such alternatives result in functional changes that are consistent with site-, age-, and diet-associated taxa. The genes and pathways identified in this study are therefore expected to drive future studies, applying tools such as community-based metabolic modeling, focusing on the mechanistic impact of different dietary regimes on the microbiome. Consequently, the data generated in this study will be crucial for the development of next-generation feed additives targeting gut health and poultry production. Video Abstract.


Conflict of interest statement

The authors declare that they have no competing interests.

Figures

Fig. 1
Fig. 1
Overview of study design and summary of 16S rRNA data. A Birds are fed one of two diets (corn and wheat) in the presence and absence of AGPs to yield four conditions. Sets of five birds are harvested at days 10, 24, and 40. B From each bird, six intestinal sites were sampled for 16S rRNA analysis; two intestinal sites (jejunum and ceca) were sampled for metatranscriptomics and blood samples collected for metabolomics analysis. C Area plots showing major taxa identified in the six sampling sites of the chicken GI tract at days 10, 24, and 40 across 4 different treatments. Only taxa with an abundance > 1% were included. Note, relative to the older birds, the upper GI sites (gizzard, duodenum, and jejunum) of the 10-day-old birds featured a high proportion of reads mapping to Streptophyta, likely reflecting a reduced breakdown of the plant-based dietary components. D PCoA plots of weighted UniFrac distances for all samples and samples grouped by sampling sites, age, diet, and AGPs. For each plot, results from PERMANOVA and PERMDISP calculations are shown
Fig. 2
Fig. 2
Microbial changes and interactions within the ceca. A Upset plot showing overlap in taxa exhibiting significant differential abundance across cecal comparisons between the four treatments over two timepoints (W = wheat; WA = wheat + AGPs; C = corn; CA = corn + AGPs). Only combinations with at least three taxa exhibiting significant changes are shown; remaining combinations are summarized in the last column. Note, to reflect the inability of 16S rRNA surveys to provide equal taxonomic resolution across all phyla and in line with previous studies [43], taxa are represented by a mix of taxonomic levels. B Box and whisker plots showing the 28 taxa that exhibit significant differences (as indicated by asterisks) in abundance due to AGPs (and not diet) in the day 40 cecal samples. C Co-occurrence networks generated with DGCA [44] for day 40 ceca samples. Each node represents a genus, shaded according to higher taxonomic levels (see inset). Links between genera indicate a significant correlation within that dataset
Fig. 3
Fig. 3
Comparison of taxon distributions for metatranscriptomic and 16S rRNA datasets. Taxonomic breakdown of sequences generated for each sample from the following: all metatranscriptomic reads mapping to a known gene/genome (top), metatranscriptomic reads mapping to rRNA sequences (middle), and mapped 16S rRNA reads (bottom)
Fig. 4
Fig. 4
Overview of metatranscriptomic analysis. A Rarefaction analysis showing the number of enzymes detected (as defined by unique EC numbers) as a function of read depth for ceca and jejunum samples. B Principal component analysis (PCA) based on annotated microbial gene expression in ceca samples. Each node represents an individual ceca sample (see inset key for type of sample). C Overlap of significantly differentially expressed genes across ceca samples, comparing AGP treatments (left) and diet (right)
Fig. 5
Fig. 5
Metabolic pathways significantly enriched with enzymes exhibiting significant changes in abundance in the presence and absence of AGP. Thirty-two pathways as defined by KEGG were enriched in enzymes exhibiting significant changes in expression in either ceca or jejunum samples, in the presence or absence of AGPs. Each pie chart shows the proportion of enzymes that were significantly up- (orange) or down-(blue) regulated in the presence of AGPs. White sectors indicate enzymes that were identified in the pathway but which did not exhibit significant differential expression
Fig. 6
Fig. 6
Taxonomic contributions to gene expression for enzymes involved in energy production. The expression of enzymes involved in glycolysis/gluconeogenesis, pentose phosphate, and tricarboxylic acid (TCA) cycle pathways is indicated for cecal samples obtained from day 24. Each pie chart represents the taxonomic contributions of enzyme expression (see key for color code). The size of pie charts indicates the average expression value (with log2 transform) of enzymes across all samples analyzed for each condition. Red arrows indicate enzymes that are significantly upregulated in comparisons involving the presence/absence of AGPs. Enzyme abbreviations are listed in Supplemental Table 11
Fig. 7
Fig. 7
Metabolites associated with the urea cycle do not decrease with age in the presence of AGPs. The main graphic shows a section of the urea cycle indicating metabolites with concentrations that change with age. Bar graphs indicate normalized metabolite concentrations at each of the three timepoints for samples obtained from control and AGP-treated birds. With the exception of L-Asp, age-related changes in metabolite concentrations are associated only with control samples. Note chickens are thought to lack N-acetylglutamate synthase, a key enzyme in the conversion of glutamate to N-acetylornithine [52]
Fig. 8
Fig. 8
Taxonomic contributions to gene expression profiles for proteins involved in cell wall biogenesis for ceca samples collected at day 24. Each node in the network indicates groups of orthologs corresponding to a specific E. coli gene (as indicated) involved in cell wall biogenesis. Links between nodes indicate a functional interaction as previously defined [53]. Size of the node indicates the relative expression of genes associated with each set of orthologs, with sector colors indicating the taxonomic contribution to gene expression (see key for color code). Red arrows indicate sets of orthologs that are significantly upregulated in comparisons involving the presence/absence of AGPs
Fig. 9
Fig. 9
Antimicrobial resistance gene expression increases with AGP supplementation. Top panel: violin plots showing distribution of ranks of the expression values of 179 CARD genes for each sample type (1st (highest) rank = highest expression across all cecal samples). With the exception of day 40 wheat samples, CARD genes exhibit significantly higher rankings of expression in samples from birds fed AGPs relative to controls (** = p < 0.01 two-sample paired t-test). Lower panel: change in ranking of 179 CARD genes (ranked across all cecal samples) in day 24 wheat samples upon supplementation with AGPs

References

    1. Taylor JH, Gordon WS. Growth-promoting activity for pigs of inactivated penicillin. Nature. 1955;176:312–313. doi: 10.1038/176312a0. - DOI - PubMed
    1. Gaskins HR, Collier CT, Anderson DB. Antibiotics as growth promotants: mode of action. Anim Biotechnol. 2002;13:29–42. doi: 10.1081/ABIO-120005768. - DOI - PubMed
    1. Van Lunen TA. Growth performance of pigs fed diets with and without tylosin phosphate supplementation and reared in a biosecure all-in all-out housing system. Can Vet J. 2003;44:571–576. - PMC - PubMed
    1. Khadem A, Soler L, Everaert N, Niewold TA. Growth promotion in broilers by both oxytetracycline and Macleaya cordata extract is based on their anti-inflammatory properties. Br J Nutr. 2014;112:1110–1118. doi: 10.1017/S0007114514001871. - DOI - PubMed
    1. Diarra MS, Malouin F. Antibiotics in Canadian poultry productions and anticipated alternatives. Front Microbiol. 2014;5:282. doi: 10.3389/fmicb.2014.00282. - DOI - PMC - PubMed

Publication types