

Quantifying the phenotypic information in mRNA abundance
- PMID: 35965452
- PMCID: PMC9376724
- DOI: 10.15252/msb.202211001
Quantifying the phenotypic information in mRNA abundance
Abstract
Quantifying the dependency between mRNA abundance and downstream cellular phenotypes is a fundamental open problem in biology. Advances in multimodal single-cell measurement technologies provide an opportunity to apply new computational frameworks to dissect the contribution of individual genes and gene combinations to a given phenotype. Using an information theory approach, we analyzed multimodal data of the expression of 83 genes in the Ca2+ signaling network and the dynamic Ca2+ response in the same cell. We found that the overall expression levels of these 83 genes explain approximately 60% of Ca2+ signal entropy. The average contribution of each single gene was 17%, revealing a large degree of redundancy between genes. Using different heuristics, we estimated the dependency between the size of a gene set and its information content, revealing that on average, a set of 53 genes contains 54% of the information about Ca2+ signaling. Our results provide the first direct quantification of information content about complex cellular phenotype that exists in mRNA abundance measurements.
Keywords: cellular heterogeneity; gene expression; information theory; mutual information; signaling dynamics.
© 2022 The Authors. Published under the terms of the CC BY 4.0 license.
Figures
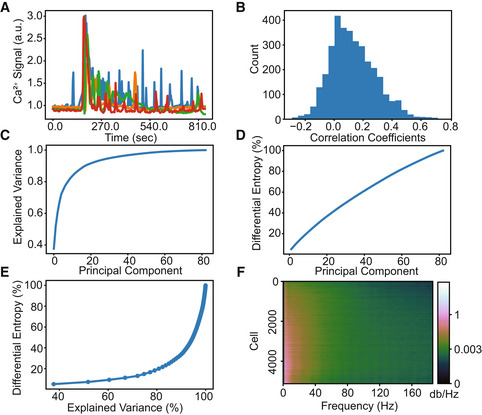
- A
Representative examples of Ca2+ dynamics of four cells in the dataset.
- B
A histogram of the pairwise gene correlation matrix (tri‐up) which highlights the relatively low correlations.
- C
Explained variance of mRNA transcript counts from PCA.
- D
Differential entropy of transcripts estimated by PCA.
- E
Plot of explained variance (panel C) vs differential entropy (panel D) with an increasing number of principal components.
- F
Dynamic Ca2+ signal periodogram (cropped to show only the lower wavelength, higher power frequencies). Ca2+ dynamic signals were found to contain a spectral entropy of 4.2 bits.
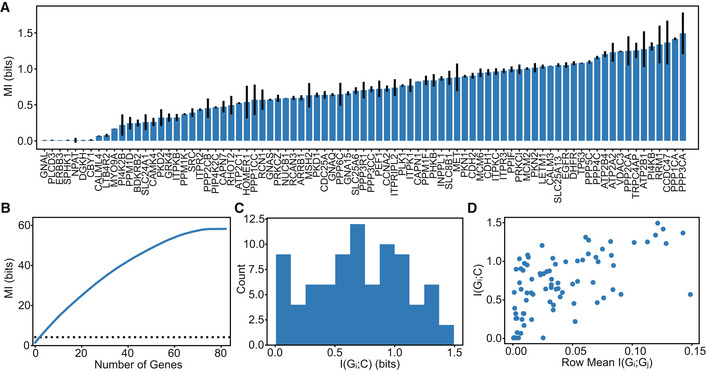
- A
I(Gi;Ca2+) sorted from least to greatest. Error bars show standard deviation of three technical replicates, that is three independent runs of the MINE algorithms on the same data.
- B
The blue line shows the cumulative sum of I(Gi;Ca2+) from (A) sorted from greatest to least, and individual genes appear to contain a lot of information (56 bits) about Ca2+ signals. The black dashed line shows mutual information between all 83 genes and Ca2+ dynamics estimated to be 2.5 bits.
- C
Histogram of (A) showing the mean I(Gi;Ca2+) is 0.7 bits.
- D
I(Gi;Gj) represents the pairwise mutual information between genes, the information that genes have about each other. This plot shows that genes that are more informative about other genes tend to be more informative about Ca2+ dynamics.
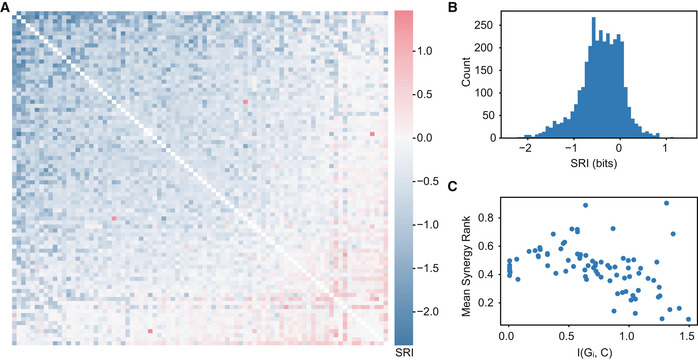
- A
SRI(Gi,Gj¦C) sorted by average SRI.
- B
Histogram of SRI showing that most gene pairs are highly redundant with an average score of −0.43 bits.
- C
The mean rank of all synergistic pairs compared to the mutual information between that gene and Ca2+ signals, (spearman r = 0.5, P < 2e‐6), indicating that genes with more information about Ca2+ are also more redundant.
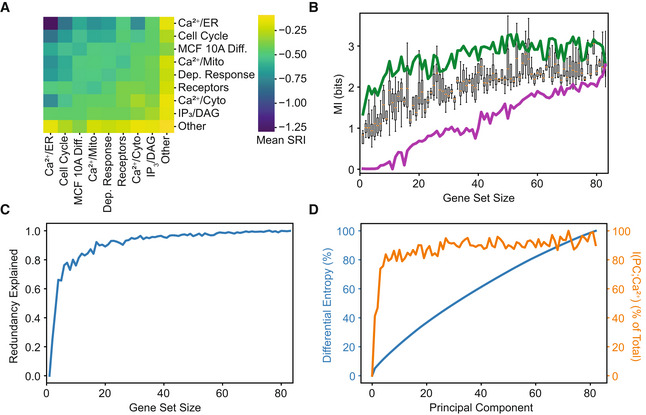
- A
Mean pairwise SRI from Fig 3 for sets based on annotation. MCF 10A differentiation and Ca2+‐dependent response are abbreviated.
- B
Gene sets of various sizes were constructed using three different strategies: an upper bound (green) that always adds the most informative gene to the set given the genes already included, random strategy (boxes, center band shows the median, box covers the 25–75% and whiskers show 95% confidence interval. Boxes are based on 12 random samples of genes) that samples random sets of genes, and a lower bound (purple) that always adds the least informative gene to the set given the genes already included.
- C
The blue line shows the fraction of redundant information using the expected value of I({G0, …, Gn};Ca2+) from equation (3).
- D
A y‐y plot of gene differential entropy in blue (same as Fig 1D) and the mutual information between gene principal components and Ca2+ in orange. Both values are normalized by their respective max values.
Similar articles
-
Increased entropy of signal transduction in the cancer metastasis phenotype.BMC Syst Biol. 2010 Jul 30;4:104. doi: 10.1186/1752-0509-4-104. BMC Syst Biol. 2010. PMID: 20673354 Free PMC article.
-
Phenotypic screen quantifying differential regulation of cardiac myocyte hypertrophy identifies CITED4 regulation of myocyte elongation.J Mol Cell Cardiol. 2014 Jul;72:74-84. doi: 10.1016/j.yjmcc.2014.02.013. Epub 2014 Mar 5. J Mol Cell Cardiol. 2014. PMID: 24613264 Free PMC article.
-
A ubiquitous GC content signature underlies multimodal mRNA regulation by DDX3X.Mol Syst Biol. 2024 Mar;20(3):276-290. doi: 10.1038/s44320-024-00013-0. Epub 2024 Jan 25. Mol Syst Biol. 2024. PMID: 38273160 Free PMC article.
-
On the Dependency of Cellular Protein Levels on mRNA Abundance.Cell. 2016 Apr 21;165(3):535-50. doi: 10.1016/j.cell.2016.03.014. Cell. 2016. PMID: 27104977 Review.
-
Analysis of cellular signal transduction from an information theoretic approach.Semin Cell Dev Biol. 2016 Mar;51:24-31. doi: 10.1016/j.semcdb.2015.12.011. Epub 2015 Dec 19. Semin Cell Dev Biol. 2016. PMID: 26710655 Review.
Cited by
-
Defining the heterogeneous molecular landscape of lung cancer cell responses to epigenetic inhibition.bioRxiv [Preprint]. 2024 Sep 24:2024.05.23.592075. doi: 10.1101/2024.05.23.592075. bioRxiv. 2024. PMID: 38853901 Free PMC article. Preprint.
-
Integrating single-cell transcriptomics with cellular phenotypes: cell morphology, Ca2+ imaging and electrophysiology.Biophys Rev. 2023 Dec 18;16(1):89-107. doi: 10.1007/s12551-023-01174-2. eCollection 2024 Feb. Biophys Rev. 2023. PMID: 38495444 Free PMC article. Review.
-
Spatial Single-Cell Mapping of Transcriptional Differences Across Genetic Backgrounds in Mouse Brains.bioRxiv [Preprint]. 2024 Oct 9:2024.10.08.617260. doi: 10.1101/2024.10.08.617260. bioRxiv. 2024. PMID: 39416191 Free PMC article. Preprint.
-
Bow-tie architectures in biological and artificial neural networks: Implications for network evolution and assay design.iScience. 2023 Jan 25;26(2):106041. doi: 10.1016/j.isci.2023.106041. eCollection 2023 Feb 17. iScience. 2023. PMID: 36818303 Free PMC article.
-
Stimulus-response signaling dynamics characterize macrophage polarization states.Cell Syst. 2024 Jun 19;15(6):563-577.e6. doi: 10.1016/j.cels.2024.05.002. Epub 2024 Jun 5. Cell Syst. 2024. PMID: 38843840 Free PMC article.
References
MeSH terms
Substances
LinkOut - more resources
Full Text Sources
Miscellaneous
