. 2022 Oct 3;380(2233):20210315.
doi: 10.1098/rsta.2021.0315. Epub 2022 Aug 15.

Statistical and agent-based modelling of the transmissibility of different SARS-CoV-2 variants in England and impact of different interventions

Affiliations

Statistical and agent-based modelling of the transmissibility of different SARS-CoV-2 variants in England and impact of different interventions

J Panovska-Griffiths et al. Philos Trans A Math Phys Eng Sci. .

Abstract

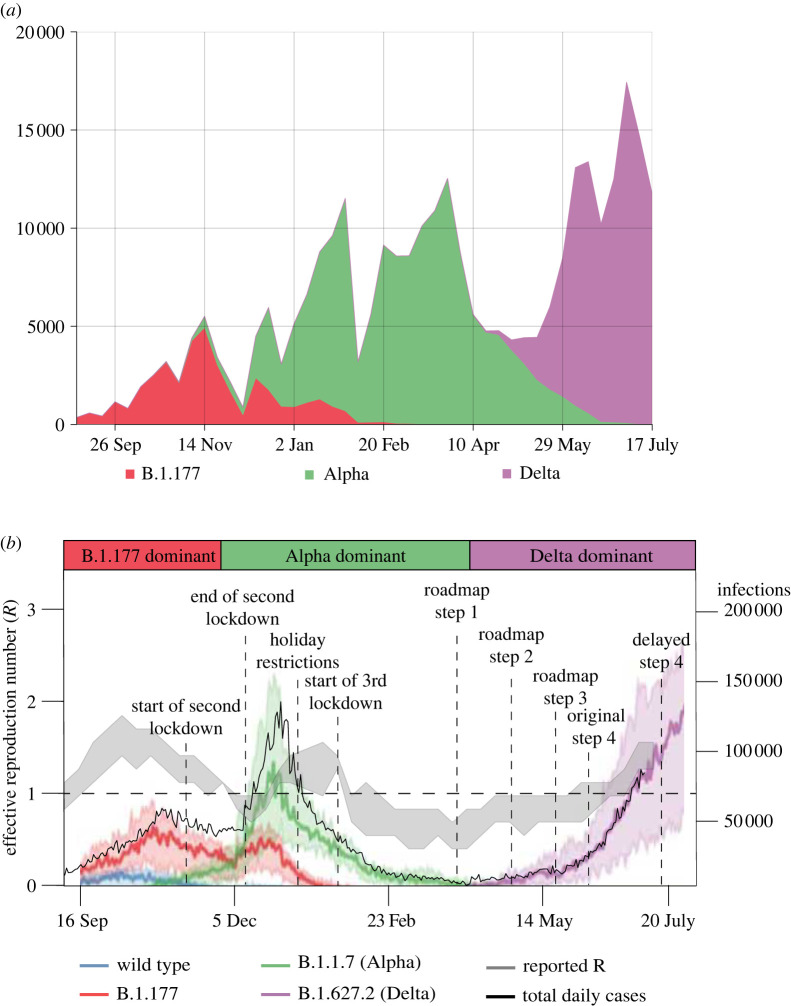
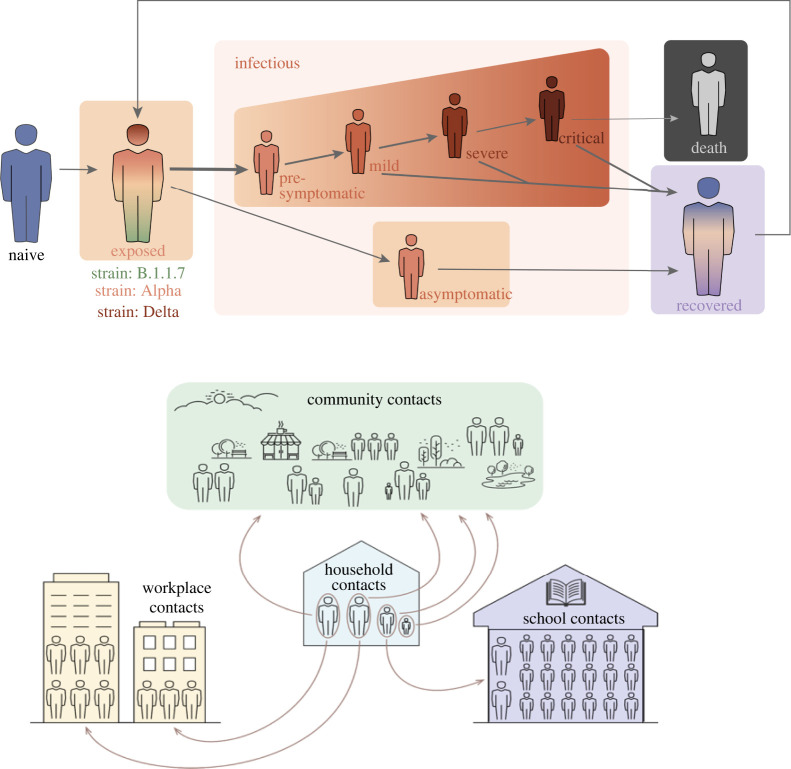
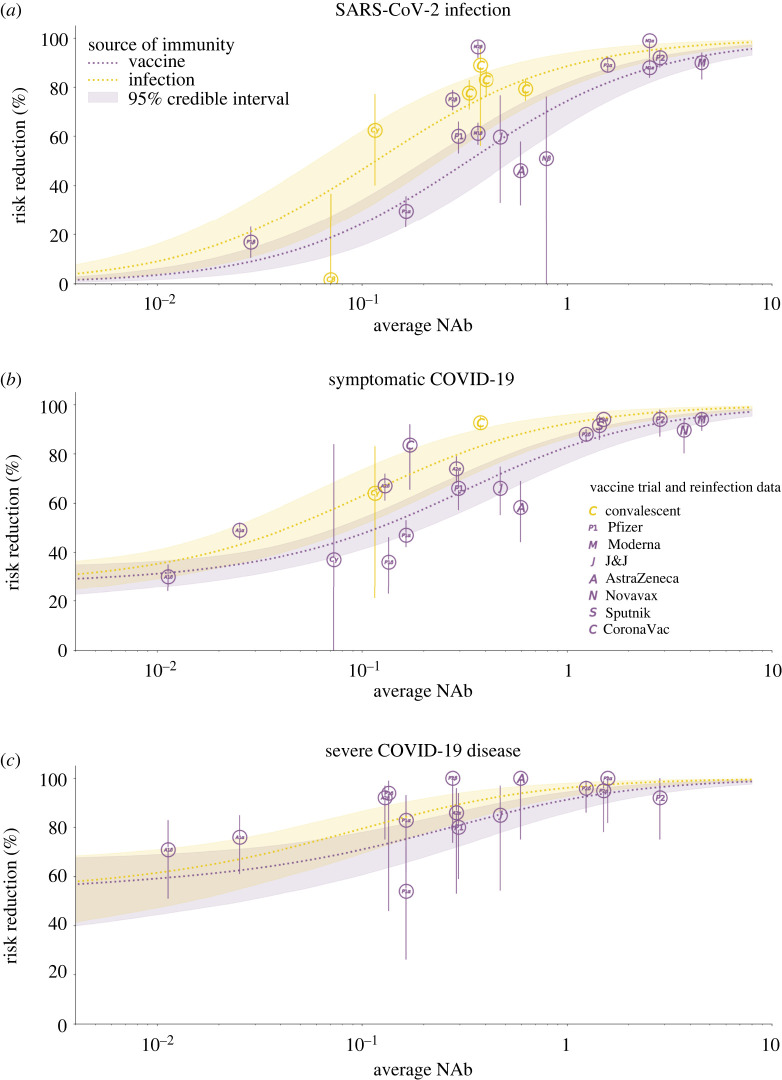
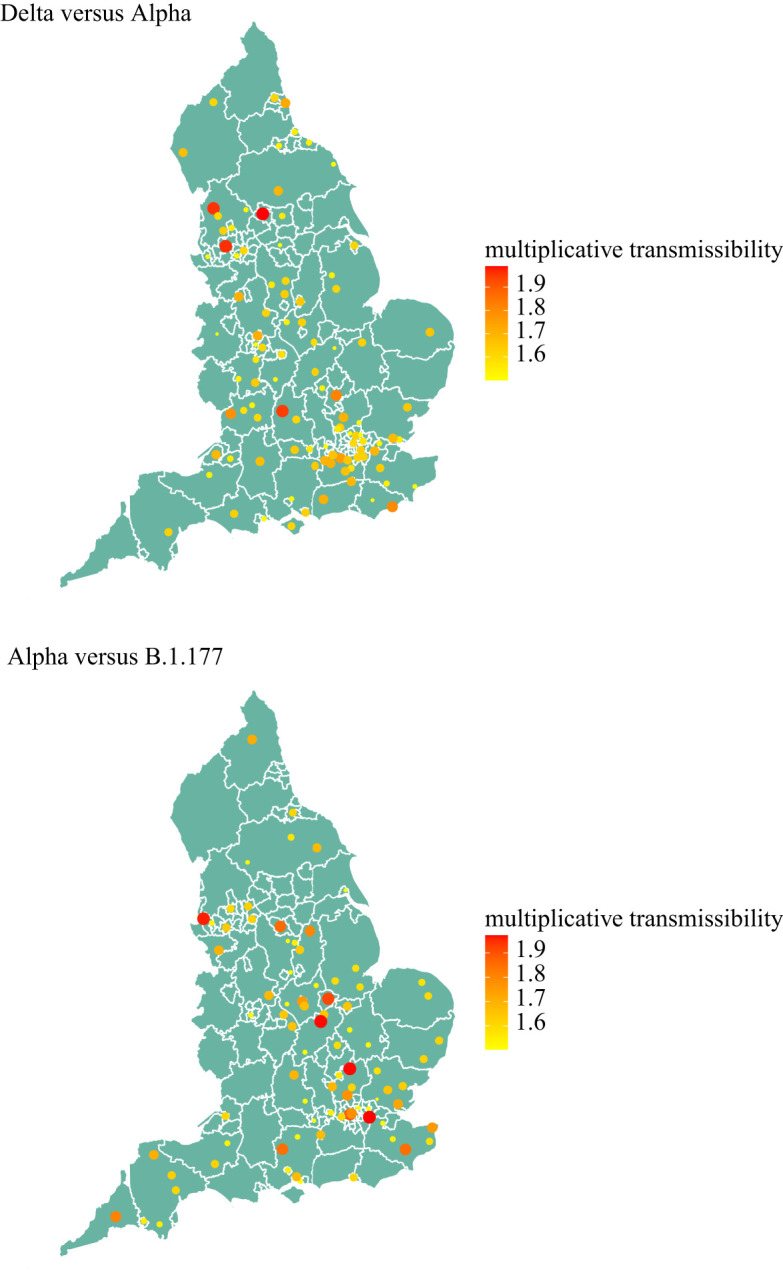
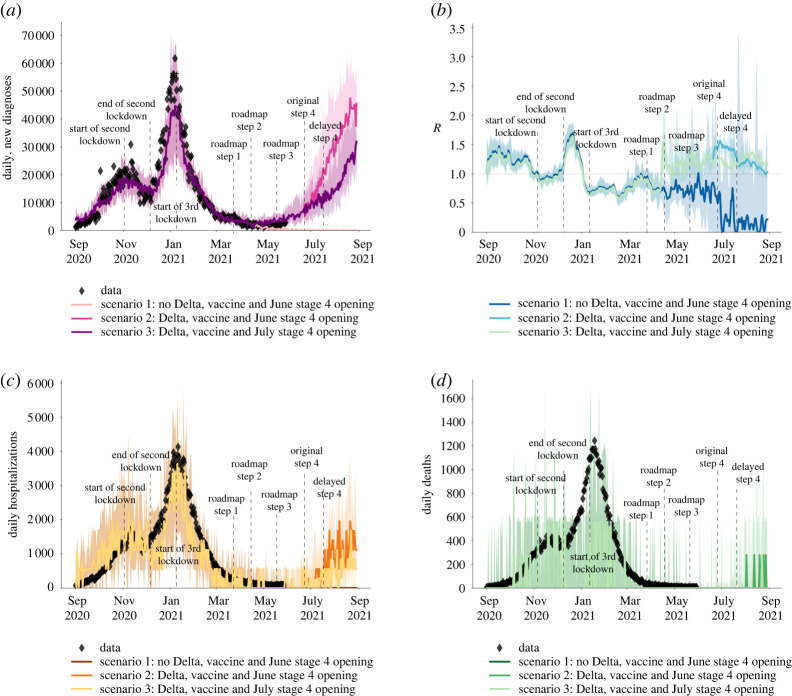
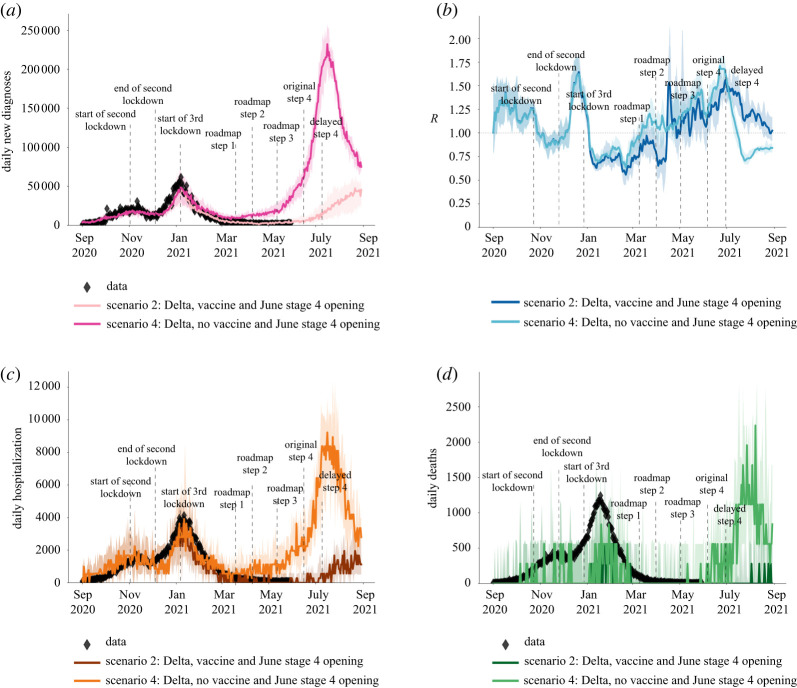
The English SARS-CoV-2 epidemic has been affected by the emergence of new viral variants such as B.1.177, Alpha and Delta, and changing restrictions. We used statistical models and the agent-based model Covasim, in June 2021, to estimate B.1.177 to be 20% more transmissible than the wild type, Alpha to be 50-80% more transmissible than B.1.177 and Delta to be 65-90% more transmissible than Alpha. Using these estimates in Covasim (calibrated 1 September 2020 to 20 June 2021), in June 2021, we found that due to the high transmissibility of Delta, resurgence in infections driven by the Delta variant would not be prevented, but would be strongly reduced by delaying the relaxation of restrictions by one month and with continued vaccination. This article is part of the theme issue 'Technical challenges of modelling real-life epidemics and examples of overcoming these'.

Keywords: COVID-19; agent-based modelling; multivariate regression modelling.


Figures

Figure 1.
Figure 1.
(a) The frequency of different SARS-CoV-2 variants using data from the COVID-19 Genomics UK Consortium (COG-UK) [1] as absolute numbers of genomes per week (as a proxy for infections by a circulating variant) and illustrating the consecutive SARS-CoV-2 variants over the study period. (b) Covasim model-generated daily infections by different SARS-CoV-2 variant type (blue, red, green and purple lines), together with data on the total number of daily cases (black line; all on the right y-axis) and the reported effective reproduction number R value (grey band and on the left y-axis), in England between September 2021 and June 2021. Bold coloured lines show the median over 100 simulations, and the shaded intervals around these show the 90% CI across the simulations. (Online version in colour.)
Figure 2.
Figure 2.
Schematic of the Covasim model showing the different modelled layers within society. This figure is reproduced with permission from [9]. (Online version in colour.)
Figure 3.
Figure 3.
Modelled vaccine efficacy used in the Covasim model for this study. Average NAb refers to the cohort-average NAb level for each individual study (represented here as a bubble), normalized to be relative to convalescent NAbs. The risk reduction in infection, symptomatic COVID-19 disease and severe COVID-19 disease following vaccination or infection are modelled as functions of NAb level. Details of the method and data sources used are given in [23]. (Online version in colour.)
Figure 4.
Figure 4.
Relative transmissibility of Delta to Alpha variant (top plot) and Alpha variant to variant B.1.177 (bottom plot) across LTLAs for the period 5 May to 12 July 2021 (Delta versus Alpha), and 7 November 2020 to 30 January 2021 (Alpha versus B.1.177). Only LTLAs with transmissibility greater than 50% higher are shown. (Online version in colour.)
Figure 5.
Figure 5.
The modelled impact of delaying step 4 of the roadmap by one month with and without the spread of the Delta variant, showing (a) the number of cases, (b) the effective reproduction number, (c) hospitalizations due to COVID-19 and (d) deaths related to COVID-19. The data from [2] are shown in diamond shapes, with the model-generated simulations overlayed. (Online version in colour.)
Figure 6.
Figure 6.
The modelled impact of vaccination against COVID-19 over the first half of 2021, showing (a) the number of cases,(b) the effective reproduction number, (c) hospitalizations due to COVID-19, and (d) deaths related to COVID-19. The data from [2] is shown in diamond shapes, with the model-generated simulations overlayed. The two curves in each of the subplots illustrate the importance of vaccination in preventing surge in cases, hospitalizations and deaths, as well as an increase in effective reproduction number R in early 2021. (Online version in colour.)

Similar articles

Cited by

References

    1. COVID-19 Genomic Surveillence https://covid19.sanger.ac.uk/lineages/raw (accessed 1 July 2021).
    1. Coronavirus (COVID-19) in the UK: UK Summary https://coronavirus.data.gov.uk (accessed 12 July 2021).
    1. Genomic epidemiology of novel coronavirus:Europe-focused subsampling. See https://nextstrain.org (accessed 12 July 2021).
    1. Prime Minister announces national lockdown https://www.gov.uk/government/news/prime-minister-announces-national-loc... (accessed 20 January 2021).
    1. COVID-19 Response- Spring 2021 (Summary) https://www.gov.uk/government/publications/covid-19-response-spring-2021... (accessed July 12, 2021).

Supplementary concepts