. 2022 Oct 3;380(2233):20210307.
doi: 10.1098/rsta.2021.0307. Epub 2022 Aug 15.

Compositional modelling of immune response and virus transmission dynamics

Affiliations

Compositional modelling of immune response and virus transmission dynamics

W Waites et al. Philos Trans A Math Phys Eng Sci. .

Abstract

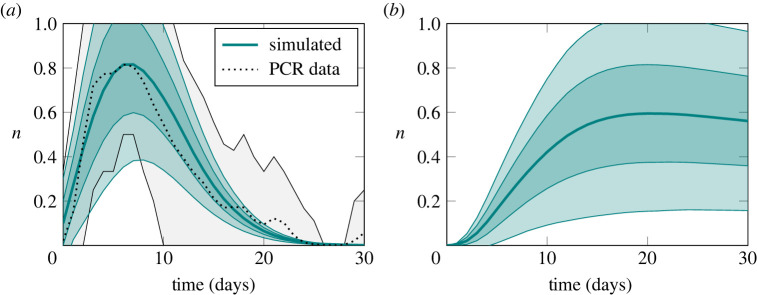
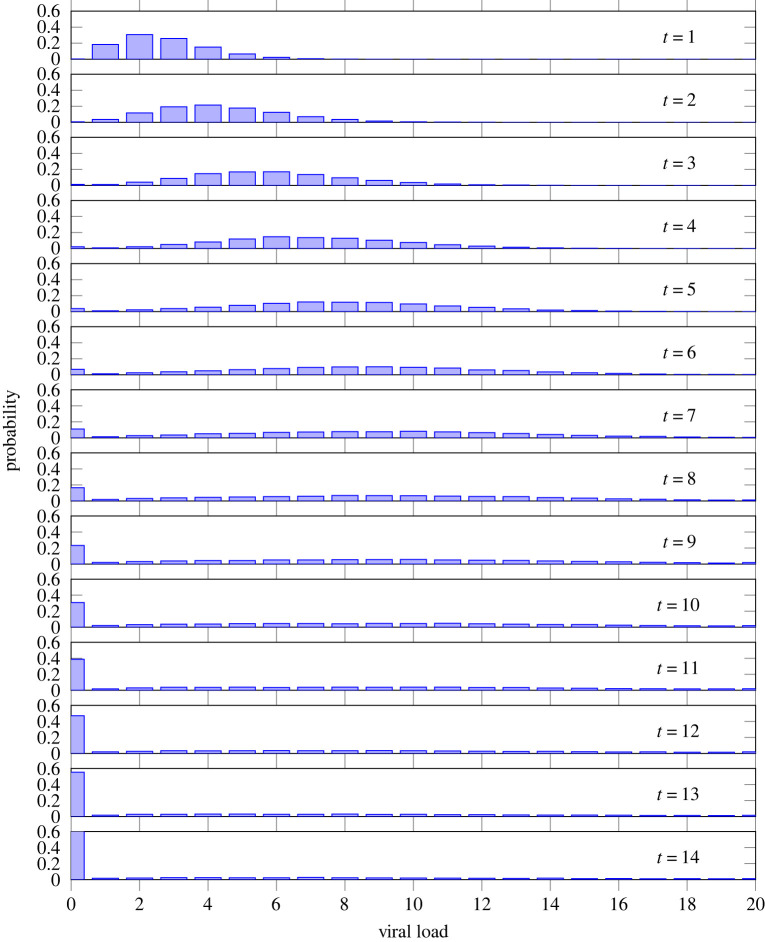
Transmission models for infectious diseases are typically formulated in terms of dynamics between individuals or groups with processes such as disease progression or recovery for each individual captured phenomenologically, without reference to underlying biological processes. Furthermore, the construction of these models is often monolithic: they do not allow one to readily modify the processes involved or include the new ones, or to combine models at different scales. We show how to construct a simple model of immune response to a respiratory virus and a model of transmission using an easily modifiable set of rules allowing further refining and merging the two models together. The immune response model reproduces the expected response curve of PCR testing for COVID-19 and implies a long-tailed distribution of infectiousness reflective of individual heterogeneity. This immune response model, when combined with a transmission model, reproduces the previously reported shift in the population distribution of viral loads along an epidemic trajectory. This article is part of the theme issue 'Technical challenges of modelling real-life epidemics and examples of overcoming these'.

Keywords: COVID-19; epidemics; immune response; multi-scale modelling; process calculi.


Figures

Figure 1.
Figure 1.
Illustration of an agent pattern with features identified. The pattern consists of two agents, A and B. Agent A has four sites: p is not bound, q is bound to a site on agent B, the binding state of r is unspecified (and normally would not be shown) and u has an internal state x and does not participate in binding. Agent B has two sites with names elided, which can often be done to avoid visual clutter where there is no risk of ambiguity. (Online version in colour.)
Figure 2.
Figure 2.
Fully active immune response with viral load x, B-cell affinity y and antibody count z.
Figure 3.
Figure 3.
Within-host immune dynamics sampled from a single simulation of a population of 10 000 individuals. The system is fit to PCR response data response as reported by Hellewell et al. [1]. Underlying processes of virus replication, affinity maturation, antibody production and virus neutralization reproduce the characteristically asymmetric viral load curve (a) and an antibody response curve (b) that lags viral load. The vertical axis in both figures is measured in arbitrary logarithmic units. The uncertainty envelopes correspond to 1 and 2 s.d. from the mean. (Online version in colour.)
Figure 4.
Figure 4.
Timeseries of probability distributions of having a viral load on a scale of 0 to nmax=20, from the same simulation of 10 000 individuals as figure 3. By day 14, 80% of viral load is concentrated in approximately 20% of individuals. (Online version in colour.)
Figure 5.
Figure 5.
Epidemic curve and viral load distributions for a rising, stationary and falling epidemic. (a) Epidemic curve showing the susceptible (S), infectious (I) and removed (R) observables for a population of 10 000 individuals calibrated for a reproduction number of 3. Envelopes show 1 and 2 s.d. over 128 simulations. Marked on the graph are two pairs of time points where the mean number of infectious individuals are equal as the epidemic rises and falls. (b) Viral load distribution at different points of the epidemic trajectory showing a rising t{20,30}, stationary t=42 and falling t{56,66} epidemic. Viral load in arbitrary logarithmic units. The probability masses of distributions are shifted to the left (lower viral loads) for a rising epidemic and the distribution for a falling epidemic is in fact bimodal with most infected individuals on the point of recovery but a significant number with slowly decaying high viral loads. (Online version in colour.)

References

    1. Hellewell J, et al. 2021. Estimating the effectiveness of routine asymptomatic PCR testing at different frequencies for the detection of SARS-CoV-2 infections. BMC Med. 19, 106. (10.1186/s12916-021-01982-x) - DOI - PMC - PubMed
    1. Houlihan CF, et al. 2020. Pandemic peak SARS-CoV-2 infection and seroconversion rates in London frontline health-care workers. Lancet 396, e6-e7. (10.1016/S0140-6736(20)31484-7) - DOI - PMC - PubMed
    1. Endo A, Centre for the Mathematical Modelling of Infectious Diseases COVID-19 Working Group, Abbott S, Kucharski AJ, Funk S. 2020. Estimating the overdispersion in COVID-19 transmission using outbreak sizes outside China. Wellcome Open Res. 5, 67. (10.12688/wellcomeopenres.15842.3) - DOI - PMC - PubMed
    1. Hay JA, Kennedy-Shaffer L, Kanjilal S, Lennon NJ, Gabriel SB, Lipsitch M, Mina MJ. 2021. Estimating epidemiologic dynamics from cross-sectional viral load distributions. Science 373, eabh0635. (10.1126/science.abh0635) - DOI - PMC - PubMed
    1. Danos V, Laneve C. 2004. Formal molecular biology. Theor. Comput. Sci. 325, 69-110. (10.1016/j.tcs.2004.03.065) - DOI