

Heterogeneity in the onwards transmission risk between local and imported cases affects practical estimates of the time-dependent reproduction number
- PMID: 35965464
- PMCID: PMC9376709
- DOI: 10.1098/rsta.2021.0308
Heterogeneity in the onwards transmission risk between local and imported cases affects practical estimates of the time-dependent reproduction number
Abstract
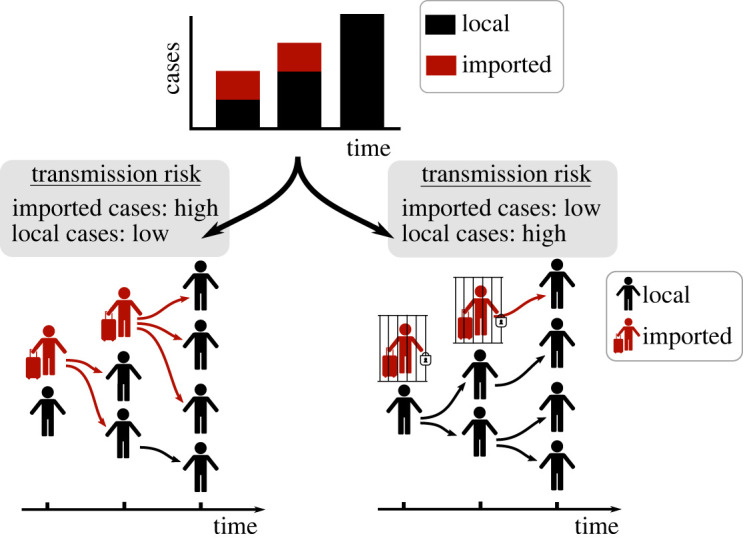
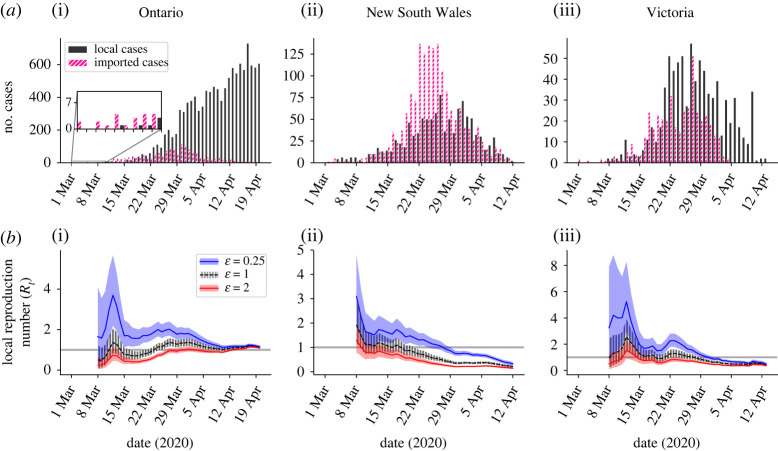
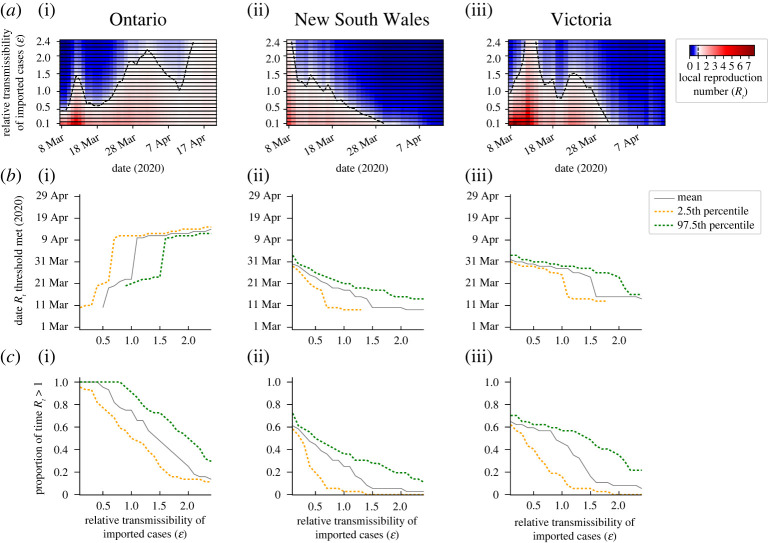
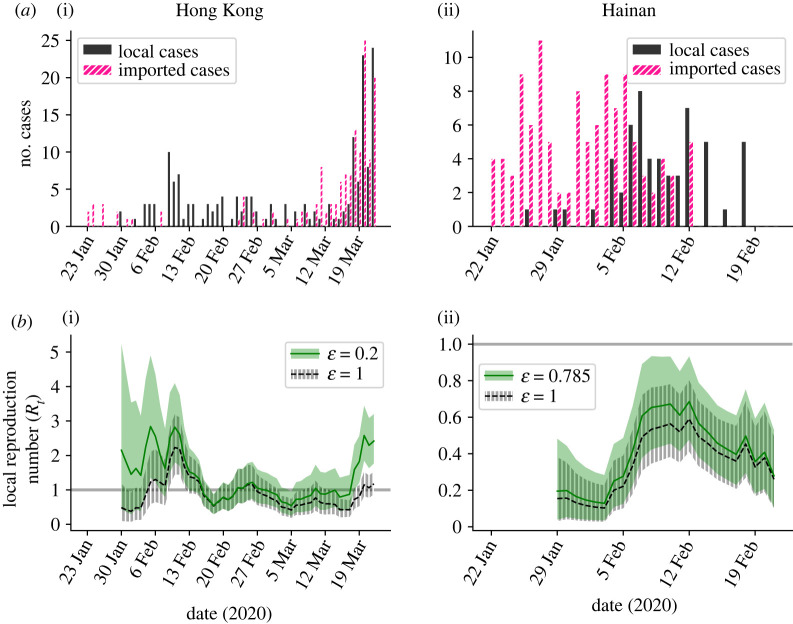
During infectious disease outbreaks, inference of summary statistics characterizing transmission is essential for planning interventions. An important metric is the time-dependent reproduction number (Rt), which represents the expected number of secondary cases generated by each infected individual over the course of their infectious period. The value of Rt varies during an outbreak due to factors such as varying population immunity and changes to interventions, including those that affect individuals' contact networks. While it is possible to estimate a single population-wide Rt, this may belie differences in transmission between subgroups within the population. Here, we explore the effects of this heterogeneity on Rt estimates. Specifically, we consider two groups of infected hosts: those infected outside the local population (imported cases), and those infected locally (local cases). We use a Bayesian approach to estimate Rt, made available for others to use via an online tool, that accounts for differences in the onwards transmission risk from individuals in these groups. Using COVID-19 data from different regions worldwide, we show that different assumptions about the relative transmission risk between imported and local cases affect Rt estimates significantly, with implications for interventions. This highlights the need to collect data during outbreaks describing heterogeneities in transmission between different infected hosts, and to account for these heterogeneities in methods used to estimate Rt. This article is part of the theme issue 'Technical challenges of modelling real-life epidemics and examples of overcoming these'.
Keywords: COVID-19; SARS-CoV-2; branching processes; imported cases; mathematical modelling; reproduction number.
Figures
Similar articles
-
Estimation of local time-varying reproduction numbers in noisy surveillance data.Philos Trans A Math Phys Eng Sci. 2022 Oct 3;380(2233):20210303. doi: 10.1098/rsta.2021.0303. Epub 2022 Aug 15. Philos Trans A Math Phys Eng Sci. 2022. PMID: 35965456 Free PMC article.
-
Estimation of age-stratified contact rates during the COVID-19 pandemic using a novel inference algorithm.Philos Trans A Math Phys Eng Sci. 2022 Oct 3;380(2233):20210298. doi: 10.1098/rsta.2021.0298. Epub 2022 Aug 15. Philos Trans A Math Phys Eng Sci. 2022. PMID: 35965466 Free PMC article.
-
New Surveillance Metrics for Alerting Community-Acquired Outbreaks of Emerging SARS-CoV-2 Variants Using Imported Case Data: Bayesian Markov Chain Monte Carlo Approach.JMIR Public Health Surveill. 2022 Nov 25;8(11):e40866. doi: 10.2196/40866. JMIR Public Health Surveill. 2022. PMID: 36265134 Free PMC article.
-
In-flight transmission of wild-type SARS-CoV-2 and the outbreak potential of imported clusters of COVID-19: a review of published evidence.Global Health. 2021 Aug 21;17(1):93. doi: 10.1186/s12992-021-00749-6. Global Health. 2021. PMID: 34419084 Free PMC article. Review.
-
A practical guide to mathematical methods for estimating infectious disease outbreak risks.J Theor Biol. 2023 Apr 7;562:111417. doi: 10.1016/j.jtbi.2023.111417. Epub 2023 Jan 20. J Theor Biol. 2023. PMID: 36682408 Review.
Cited by
-
Simulation-based inference of the time-dependent reproduction number from temporally aggregated and under-reported disease incidence time series data.Philos Trans A Math Phys Eng Sci. 2025 Apr 2;383(2293):20240412. doi: 10.1098/rsta.2024.0412. Epub 2025 Apr 2. Philos Trans A Math Phys Eng Sci. 2025. PMID: 40172553 Free PMC article.
-
The impact of cross-reactive immunity on the emergence of SARS-CoV-2 variants.Front Immunol. 2023 Jan 11;13:1049458. doi: 10.3389/fimmu.2022.1049458. eCollection 2022. Front Immunol. 2023. PMID: 36713397 Free PMC article.
-
Estimation of local time-varying reproduction numbers in noisy surveillance data.Philos Trans A Math Phys Eng Sci. 2022 Oct 3;380(2233):20210303. doi: 10.1098/rsta.2021.0303. Epub 2022 Aug 15. Philos Trans A Math Phys Eng Sci. 2022. PMID: 35965456 Free PMC article.
-
Using real-time modelling to inform the 2017 Ebola outbreak response in DR Congo.Nat Commun. 2024 Jul 6;15(1):5667. doi: 10.1038/s41467-024-49888-5. Nat Commun. 2024. PMID: 38971835 Free PMC article.
-
Real-time inference of the end of an outbreak: Temporally aggregated disease incidence data and under-reporting.Infect Dis Model. 2025 Apr 1;10(3):935-945. doi: 10.1016/j.idm.2025.03.009. eCollection 2025 Sep. Infect Dis Model. 2025. PMID: 40475698 Free PMC article.
References
MeSH terms
LinkOut - more resources
Full Text Sources
Medical
Miscellaneous
