. 2022 Oct 3;380(2233):20210298.
doi: 10.1098/rsta.2021.0298. Epub 2022 Aug 15.

Estimation of age-stratified contact rates during the COVID-19 pandemic using a novel inference algorithm

Affiliations

Estimation of age-stratified contact rates during the COVID-19 pandemic using a novel inference algorithm

Christopher M Pooley et al. Philos Trans A Math Phys Eng Sci. .

Abstract

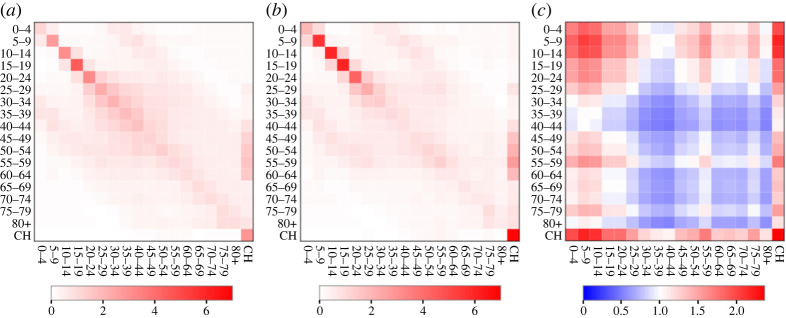
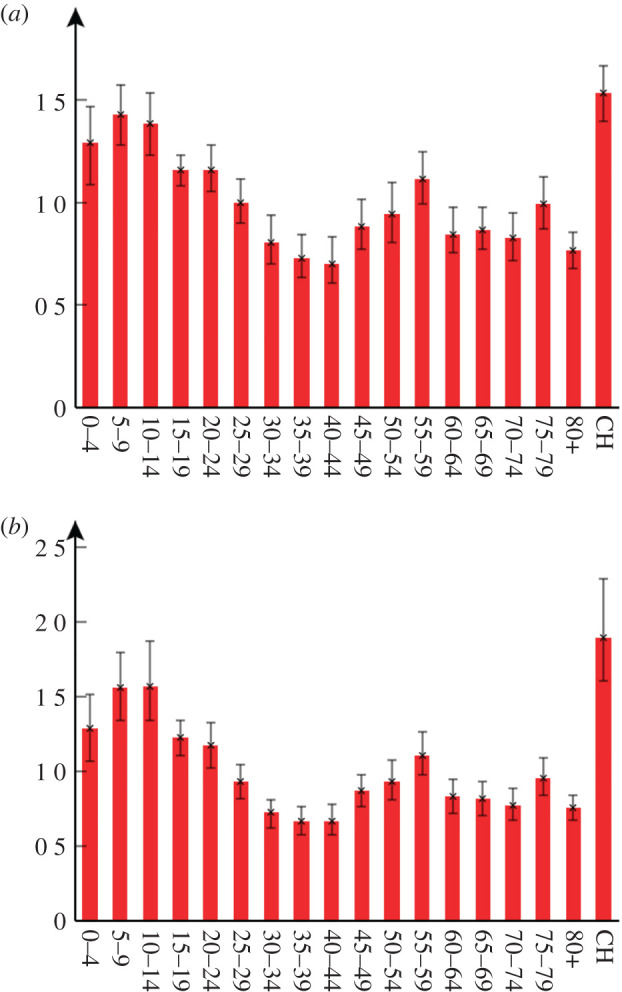
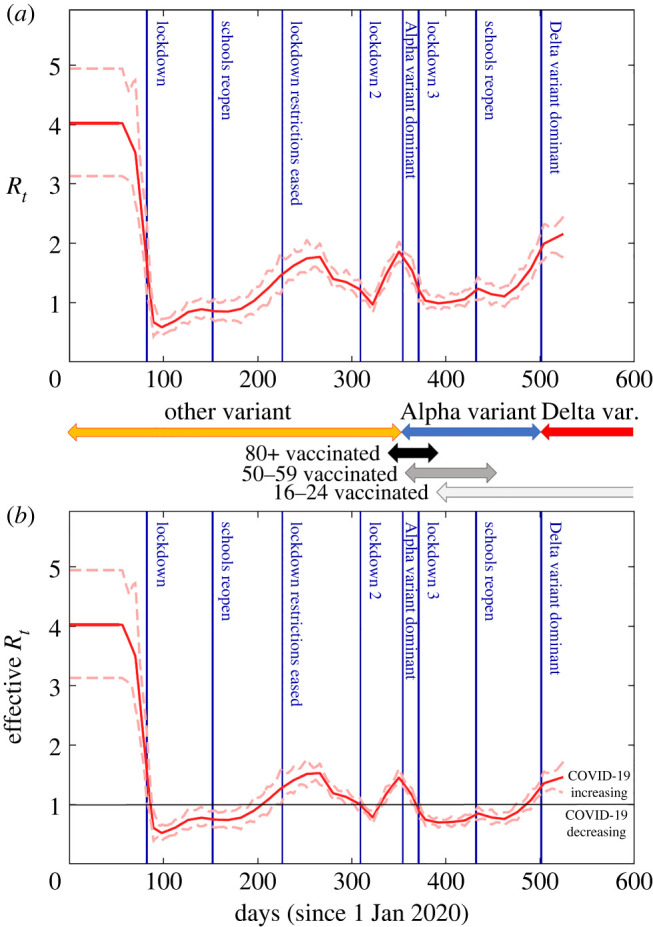
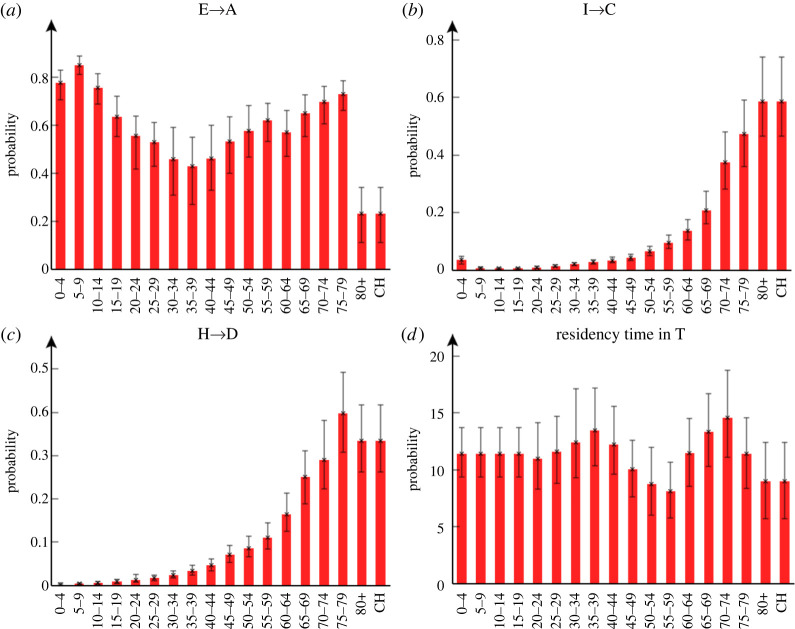
Well parameterized epidemiological models including accurate representation of contacts are fundamental to controlling epidemics. However, age-stratified contacts are typically estimated from pre-pandemic/peace-time surveys, even though interventions and public response likely alter contacts. Here, we fit age-stratified models, including re-estimation of relative contact rates between age classes, to public data describing the 2020-2021 COVID-19 outbreak in England. This data includes age-stratified population size, cases, deaths, hospital admissions and results from the Coronavirus Infection Survey (almost 9000 observations in all). Fitting stochastic compartmental models to such detailed data is extremely challenging, especially considering the large number of model parameters being estimated (over 150). An efficient new inference algorithm ABC-MBP combining existing approximate Bayesian computation (ABC) methodology with model-based proposals (MBPs) is applied. Modified contact rates are inferred alongside time-varying reproduction numbers that quantify changes in overall transmission due to pandemic response, and age-stratified proportions of asymptomatic cases, hospitalization rates and deaths. These inferences are robust to a range of assumptions including the values of parameters that cannot be estimated from available data. ABC-MBP is shown to enable reliable joint analysis of complex epidemiological data yielding consistent parametrization of dynamic transmission models that can inform data-driven public health policy and interventions. This article is part of the theme issue 'Technical challenges of modelling real-life epidemics and examples of overcoming these'.

Keywords: Bayesian inference; COVID-19; approximate Bayesian computation; contact matrix; model-based proposals; reproduction number.


Figures

Figure 1.
Figure 1.
The compartmental model. The compartments are defined as follows: S: susceptible, E: exposed, A: asymptomatic, I: infectious, T: PCR test-sensitive but non-infectious, C: infected but non-infectious (due to self-isolation), H: hospitalized (or potentially care home in the case of care home residents), R: recovered and D: dead. Variable mc gives the mean residency time in a compartment c (with individual residency times exponentially distributed about this mean) and baAB gives the branching probability for an individual in age group a going from compartment A to B (note, these probabilities are constrained to add up to one when leaving a given compartment). The term λa,t refers to the time-dependent force of infection acting on individuals in age group a. The annotations also indicate how data from the COVID-19 epidemic in England inform inference. Survey data are taken to provide an unbiased estimate of proportions of the total population in the sum of classes A, I, T, C (PCR survey) and R (seroprevalence). Operational data are used to inform transition rates E → I (test positive cases for second pandemic wave), C → H (hospitalizations) and H → D (deaths in hospitals and care homes). (Online version in colour.)
Figure 2.
Figure 2.
The contact matrix. (a) The pre-pandemic matrix C0 based on the BBC Pandemic study [19] (see electronic supplementary material, appendix C). For an individual represented by an age group on the x-axis this shows the estimated numbers of daily contacts they make with individuals in the same and different age groups on the y-axis (darker red colours indicate more frequent contacts). (b) The inferred age-adjusted contact matrix C based on COVID-19 data. (c) The factor difference in C over C0 (red colours indicate an increase and blue colours a decrease). (Online version in colour.)
Figure 3.
Figure 3.
Age contact factors and variation in susceptibility. This shows two alternative models used to fit the data: (a) age contact factors v modify the pre-pandemic contact matrix C0 for different age groups in the population (see equation (2.1)). (b) Age groups are given a relative susceptibility to acquiring infection (see equation (4.1)). The error bars show 95% credible intervals. (Online version in colour.)
Figure 4.
Figure 4.
Time variation in reproduction number. (a) The inferred value of the reproduction number Rt as a function of time (solid red line gives posterior mean and dashed lines indicate the 95% credible interval). This is proportional to the overall effective contact rate (see equation (2.3)). (b) The effective reproduction number Rteff (which accounts for the fact that a fraction of the population is not susceptible). Above/below the horizontal black line shows where COVID-19 is increasing/decreasing. The vertical blue lines denote important milestones during the epidemic [31]. Arrows showing changes in the dominant COVID-19 variant are estimated from COG UK [32] (see electronic supplementary material, appendix O) and for vaccination come from CIS [33] (these indicate the time period in which between 5% and 95% of individuals are vaccinated with the first dose for selected age groups). (Online version in colour.)
Figure 5.
Figure 5.
Age-dependent branching probabilities and residency time in T. The probability of: (a) becoming asymptomatic, (b) becoming hospitalized given a case (note, for care home patients ‘hospitalized’ may mean going to hospital or becoming critically ill within a care home) and (c) of death given hospitalized. (d) Shows the residency time in the PCR test-sensitive T compartment. The error bars indicate 95% credible intervals. (Online version in colour.)
Figure 6.
Figure 6.
Simulation results and data. These plots show age-aggregated data (black) against 500 simulations (blue 'cloud' of curves) performed using model parameters taken from the analysis posterior means (see Table R1 of the electronic supplementary results). The red lines indicate an average across simulations; these are smoother, and typically have peaks greater than the data. (a) The total population in the infected I, C, A and T compartments (data from CIS), (b) daily cases and (c) daily hospital admissions (not including care home patients), (d) daily deaths and (e) total recovered (excludes 0–14 age groups and care home residents, single data point from antibody results in CIS). Visualizing complex data that vary in scale is revealing but challenging [37]. Here we cut off the first peak to better reveal structure in later stages of the outbreak. (Online version in colour.)

Similar articles

Cited by

References

    1. Heesterbeek H et al. 2015. Modeling infectious disease dynamics in the complex landscape of global health. Science 347, aaa4339. (10.1126/science.aaa4339) - DOI - PMC - PubMed
    1. Brooks-Pollock E, Danon L, Jombart T, Pellis L. 2021. Modelling that shaped the early COVID-19 pandemic response in the UK. Phil. Trans. R. Soc. B 376, 20210001. (10.1098/rstb.2021.0001) - DOI - PMC - PubMed
    1. Ackley SF, Lessler J, Glymour MM. 2021. Dynamical modeling as a tool for inferring causation. Am. J. Epidemiol. 191, 1-6. (10.1093/aje/kwab222) - DOI - PMC - PubMed
    1. De Angelis D, Presanis AM, Birrell PJ, Tomba GS, House T. 2015. Four key challenges in infectious disease modelling using data from multiple sources. Epidemics 10, 83-87. (10.1016/j.epidem.2014.09.004) - DOI - PMC - PubMed
    1. Lau MS, Grenfell B, Thomas M, Bryan M, Nelson K, Lopman B. 2020. Characterizing superspreading events and age-specific infectiousness of SARS-CoV-2 transmission in Georgia, USA. Proc. Natl Acad. Sci. USA 117, 22 430-22 435. (10.1073/pnas.2011802117) - DOI - PMC - PubMed