. 2022 Oct 3;380(2233):20210301.
doi: 10.1098/rsta.2021.0301. Epub 2022 Aug 15.

Fitting the reproduction number from UK coronavirus case data and why it is close to 1

Affiliations

Fitting the reproduction number from UK coronavirus case data and why it is close to 1

Graeme J Ackland et al. Philos Trans A Math Phys Eng Sci. .

Abstract

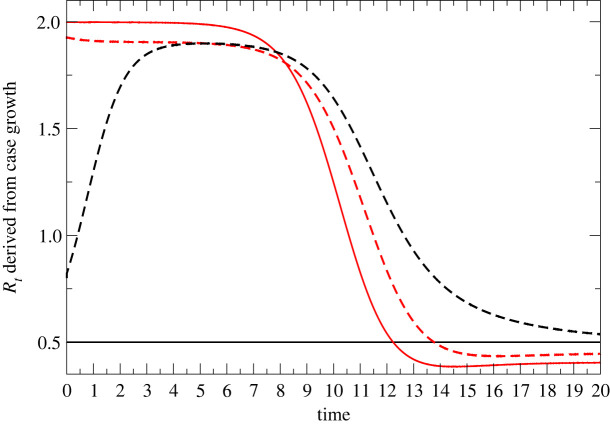
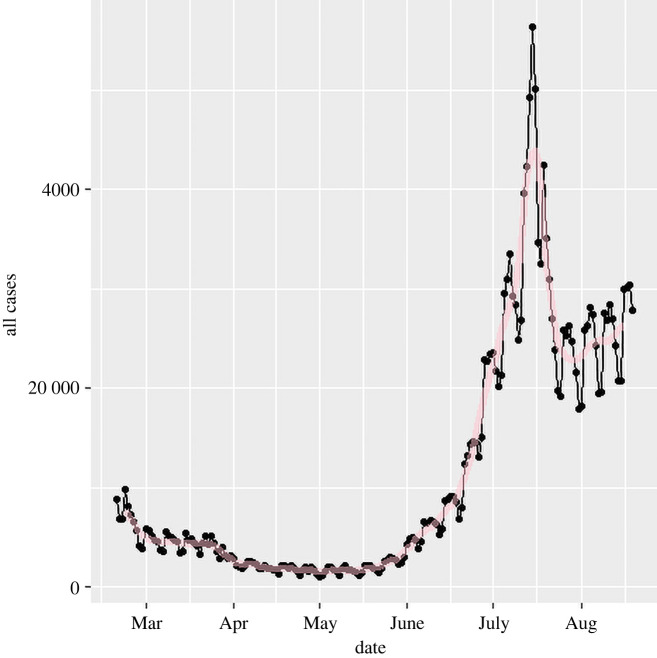
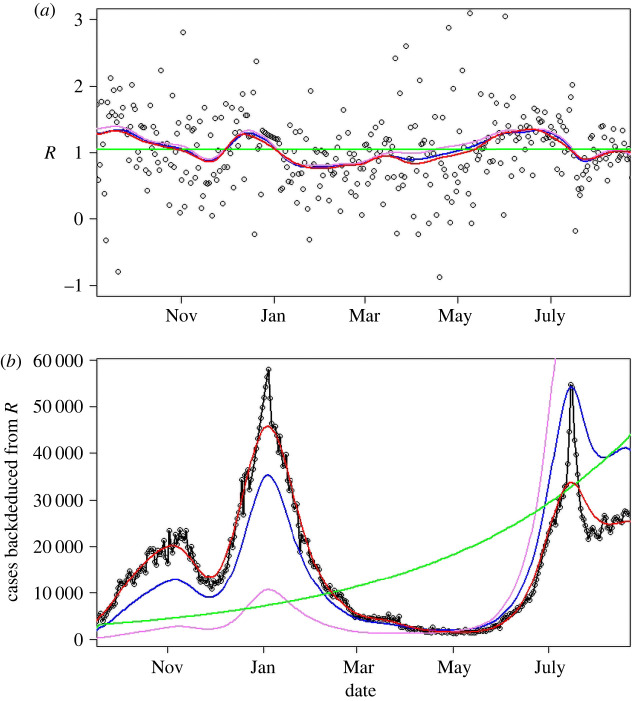
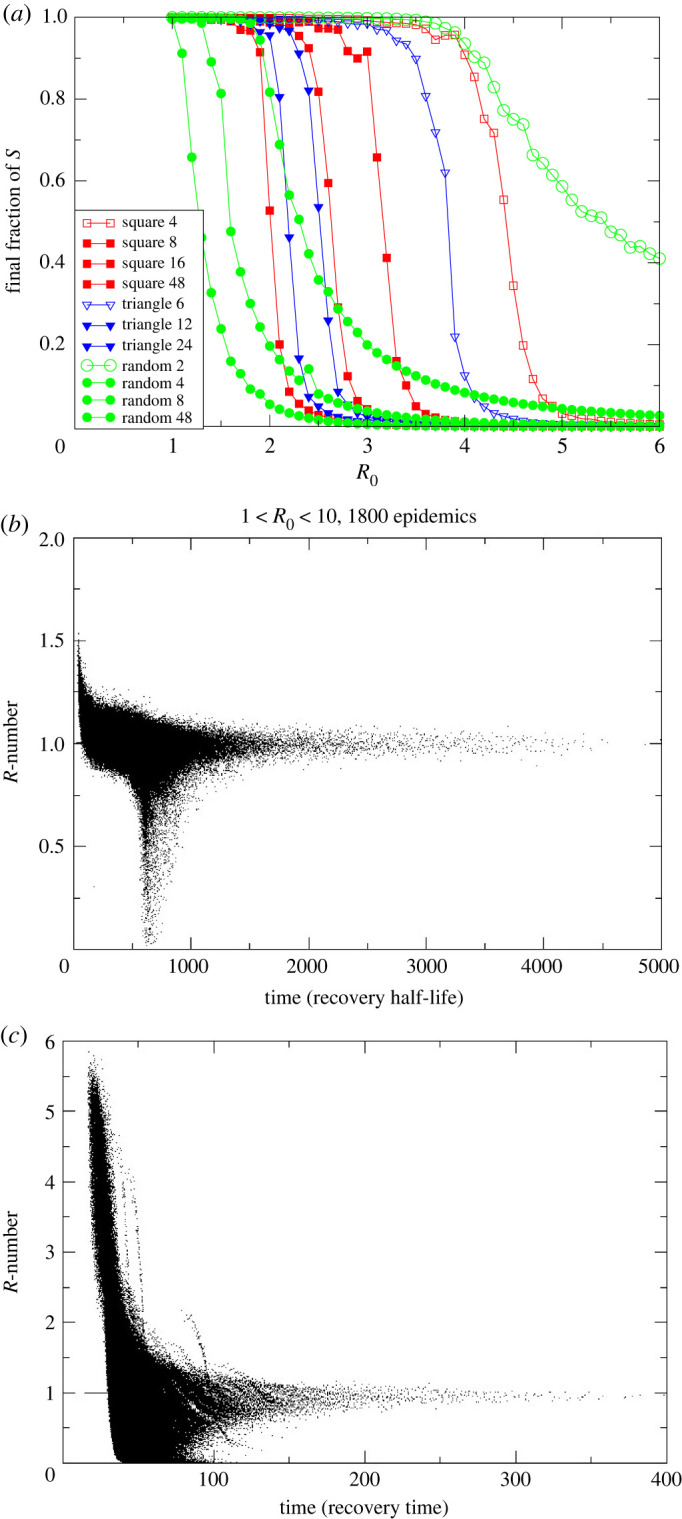
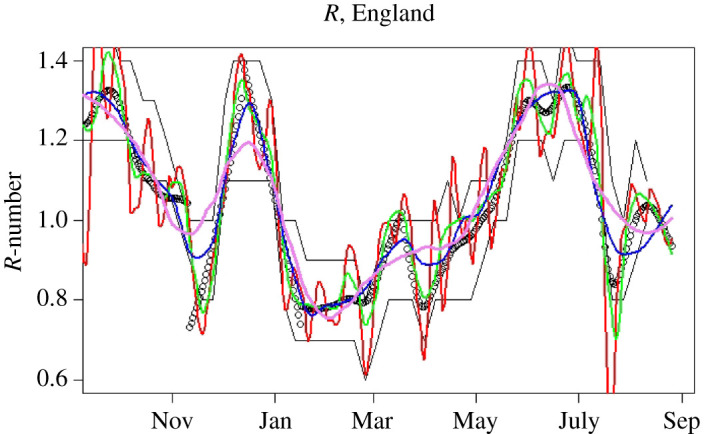
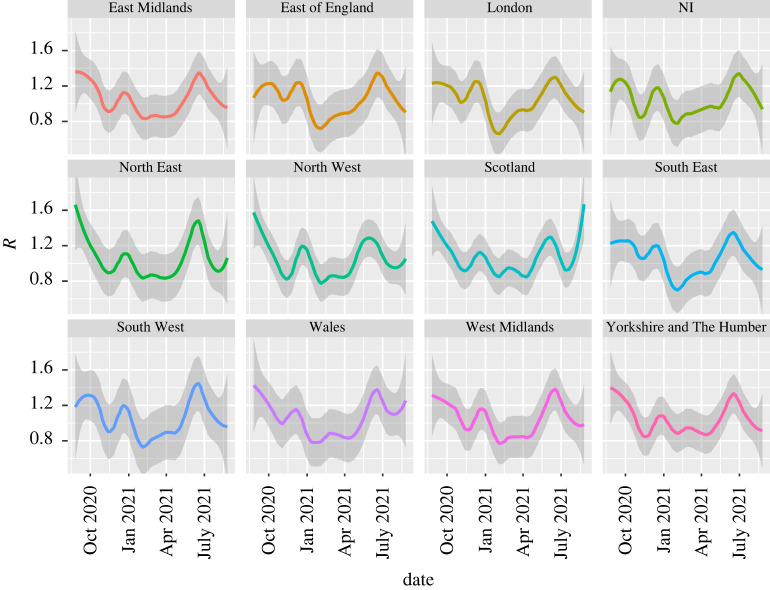
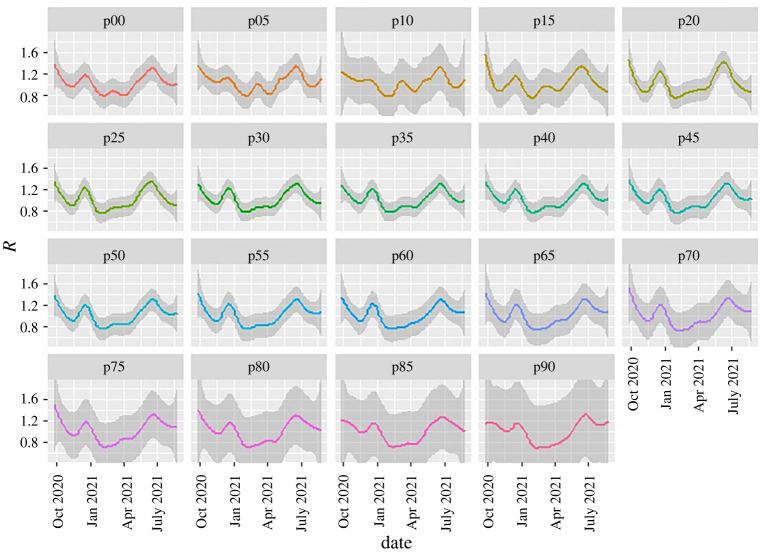
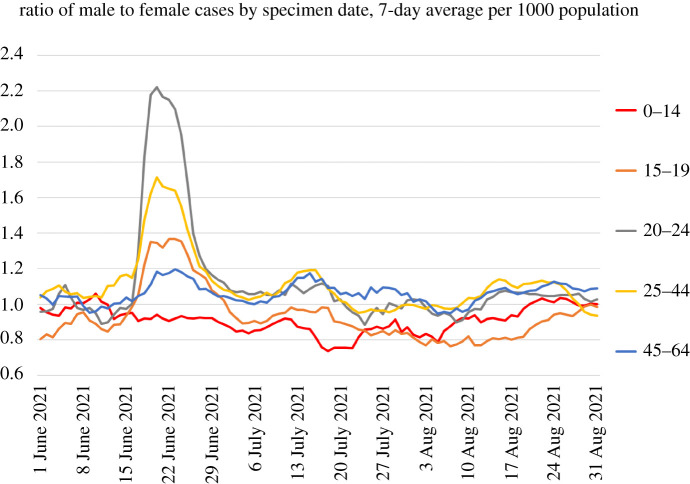
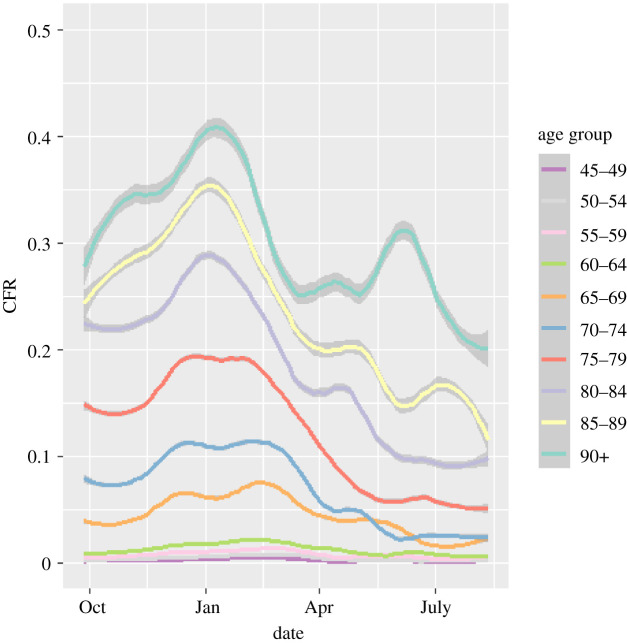
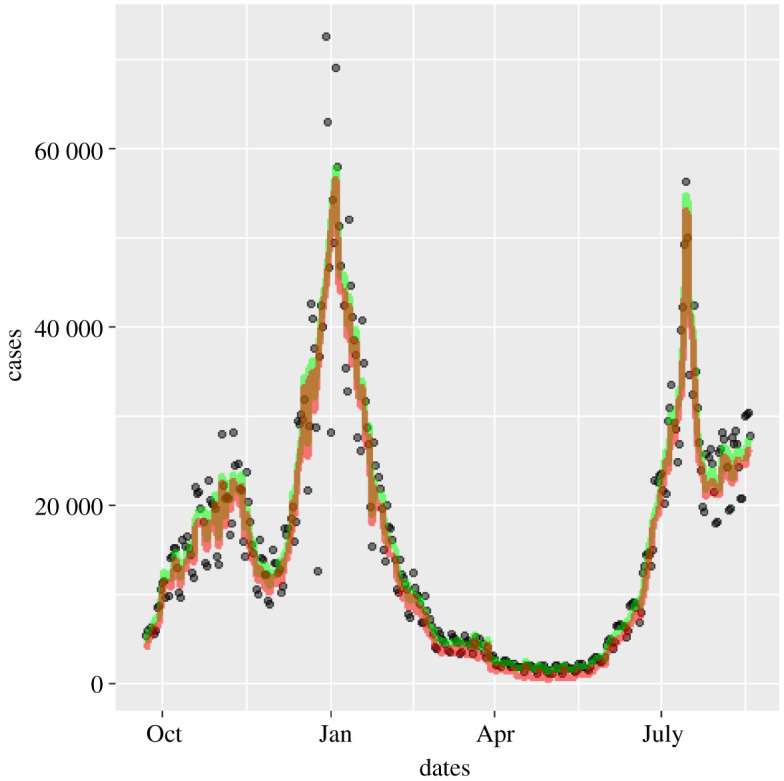
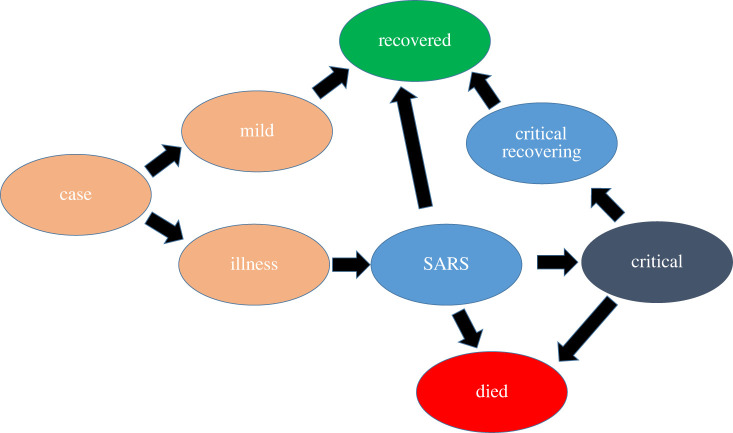
We present a method for rapid calculation of coronavirus growth rates and [Formula: see text]-numbers tailored to publicly available UK data. We assume that the case data comprise a smooth, underlying trend which is differentiable, plus systematic errors and a non-differentiable noise term, and use bespoke data processing to remove systematic errors and noise. The approach is designed to prioritize up-to-date estimates. Our method is validated against published consensus [Formula: see text]-numbers from the UK government and is shown to produce comparable results two weeks earlier. The case-driven approach is combined with weight-shift-scale methods to monitor trends in the epidemic and for medium-term predictions. Using case-fatality ratios, we create a narrative for trends in the UK epidemic: increased infectiousness of the B1.117 (Alpha) variant, and the effectiveness of vaccination in reducing severity of infection. For longer-term future scenarios, we base future [Formula: see text] on insight from localized spread models, which show [Formula: see text] going asymptotically to 1 after a transient, regardless of how large the [Formula: see text] transient is. This accords with short-lived peaks observed in case data. These cannot be explained by a well-mixed model and are suggestive of spread on a localized network. This article is part of the theme issue 'Technical challenges of modelling real-life epidemics and examples of overcoming these'.

Keywords: R-number; SIR model; compartment model; coronavirus; epidemic.


Figures

Figure 1.
Figure 1.
Detectable urban/rural R-numbers from coupled SIR model. Both i(0)=0.00001. Red lines are Rt values derived from urban/rural populations i1, and black lines relate to populations i2, using equations (1.3) and (1.4). Solid lines show no mixing (x=0); dashed lines correspond to x=0.05. The time axis is in units of the generation time. (Online version in colour.)
Figure 2.
Figure 2.
As-published official data on 2021 cases for England (dots). A strong weekly oscillation is evident. Although it is plausible that more infections happen on weekdays when people are at work, we will assume the oscillation is from the amount of testing. The red line shows the effect of applying the seven-day filter (equation (2.5)). (Online version in colour.)
Figure 3.
Figure 3.
(a) R values calculated from various methods in the period September 2020–September 2021. Black circles, R~ from equation (2.10); violet, Ito integration plus smoothing of R~; blue, log integration plus smoothing of R~; red, smoothing of C~ plus log integration; green, average value. (b) Modelled case numbers using these R-numbers from October 2020, with initial case numbers chosen to give correct total number of cases; black circles show actual data, which R~ reproduces by construction. (Online version in colour.)
Figure 4.
Figure 4.
(a) Size of the final epidemic for various network structures and values of R0. Legend gives the different lattice structures and the number of connections each has. To set equivalent R0, infection probability per link is lower in more highly connected lattices. (b) Scatterplot of measured R(t)=ΔS/ΔR from simulations with eight-neighbour square lattice, 500 000 sites, and R0 ranging from 1 to 10. Twenty simulations at each 0.1 increment in R0 are shown. Timescale has recovery rate set to 1 and R(t) is plotted against t in units of the recovery time. Other lattices are similar. (c) Small-world version of (b) with eight neighbours plus one added long-range connection. (Online version in colour.)
Figure 5.
Figure 5.
R-numbers for England, September 2020–September 2021. Black points represent our central estimates, based on piecewise fits between major locking and unlocking events. Red, green, blue and violet lines show LOESS smoothed R-numbers from equation (2.10) with span=0.05, 0.1, 0.2 and 0.3, respectively (span controls the amount of smoothing). Black lines are the published bounds on R data from the SPI-M consensus; to obtain this agreement, the consensus values are assigned to a date 16 days before publication. (Online version in colour.)
Figure 6.
Figure 6.
R-numbers for UK nations and English regions calculated with WSS; shading represents the LOESS confidence interval associated with the smoothing (here, LOESS with span=0.3). December and June peaks associated with the Alpha and Delta variants are evident in all regions. Blips in September and March correspond to low case numbers and may be artefacts. (Online version in colour.)
Figure 7.
Figure 7.
WSS R-number prediction method applied to case data split by five-year age groups, with ‘p’ indicating the youngest year-group. Data are averaged across all England; shading represents the LOESS confidence interval associated with the smoothing (here, LOESS with span=0.3). Uncertainty increases by age because of larger fluctuations, which in turn arise from smaller total numbers of cases. See main text explaining why this is a scaled growth rate and not a conventional R-number. (Online version in colour.)
Figure 8.
Figure 8.
Ratio of male to female COVID-19 cases by age group, based on UK government data [5], showing a sharp peak in June 2021. The peak is similar to the two-population behaviour of figure 1. (Online version in colour.)
Figure 9.
Figure 9.
Case-fatality ratios, 2020–2021, plotted as deaths per case from the WSS model, by age group. Lines are weighted smoothed fits to the data. CFR graphs for people aged under 45 are excluded as they are so low. Shading shows uncertainty introduced by smoothing day-to-day variations, excluding errors on the mean from small-number statistics in September 2020 and May 2021. The eye-catching peak for the 90+ age group in June 2021 is probably a small-number effect, and it can be eliminated completely by combining the 85–89 and 90+ age groups. (Online version in colour.)
Figure 10.
Figure 10.
Effect of removing weekend and Christmas systematic errors on 2020–2021 cases: positive first PCR test data as published (circles) [5], weekend and Christmas smoothed case data (green) and data corrected for 0.4% false positives (red) [10]. (Online version in colour.)
Figure 11.
Figure 11.
Schematic flow chart for WSS compartment model. The SARS compartment acts as a proxy for hospitalization, and the critical compartment for intensive care. (Online version in colour.)

Similar articles

Cited by

References

    1. Ali ST, Wang L, Lau EH, Xu XK, Du Z, Wu Y, Leung GM, Cowling BJ. 2020. Serial interval of SARS-CoV-2 was shortened over time by nonpharmaceutical interventions. Science 369, 1106-1109. (10.1126/science.abc9004) - DOI - PMC - PubMed
    1. Ferretti L, Wymant C, Kendall M, Zhao L, Nurtay A, Abeler-Dörner L, Parker M, Bonsall D, Fraser C. 2020. Quantifying SARS-CoV-2 transmission suggests epidemic control with digital contact tracing. Science 368, eabb6936. (10.1126/science.abb6936) - DOI - PMC - PubMed
    1. Lau YC et al. 2021. Joint estimation of generation time and incubation period for coronavirus disease 2019. J. Infect. Dis. 224, 1664-1671. - PMC - PubMed
    1. Office for National Statistics. 2020. Coronavirus (COVID-19) in the UK. https://www.gov.uk/guidance/coronavirus-covid-19-information-for-the-public.
    1. UK Government. 2020 Coronavirus (COVID-19) in the UK. https://coronavirus.data.gov.uk/.

LinkOut - more resources