

Comprehensive analysis of the glutathione S-transferase Mu (GSTM) gene family in ovarian cancer identifies prognostic and expression significance
- PMID: 35965498
- PMCID: PMC9366399
- DOI: 10.3389/fonc.2022.968547
Comprehensive analysis of the glutathione S-transferase Mu (GSTM) gene family in ovarian cancer identifies prognostic and expression significance
Abstract
Background: Ovarian cancer (OC) is one of the most common types of gynecologic tumor over the world. The Glutathione S-transferase Mu (GSTM) has five members, including GSTM1-5. These GSTMs is involved in cell metabolism and detoxification, but their role in OC remains unknown.
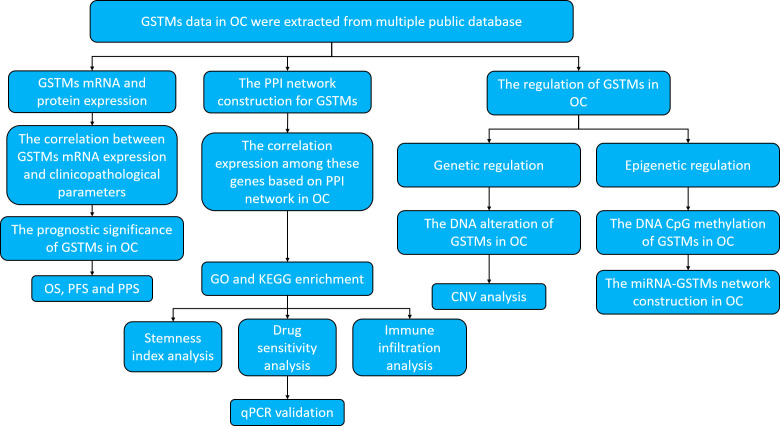
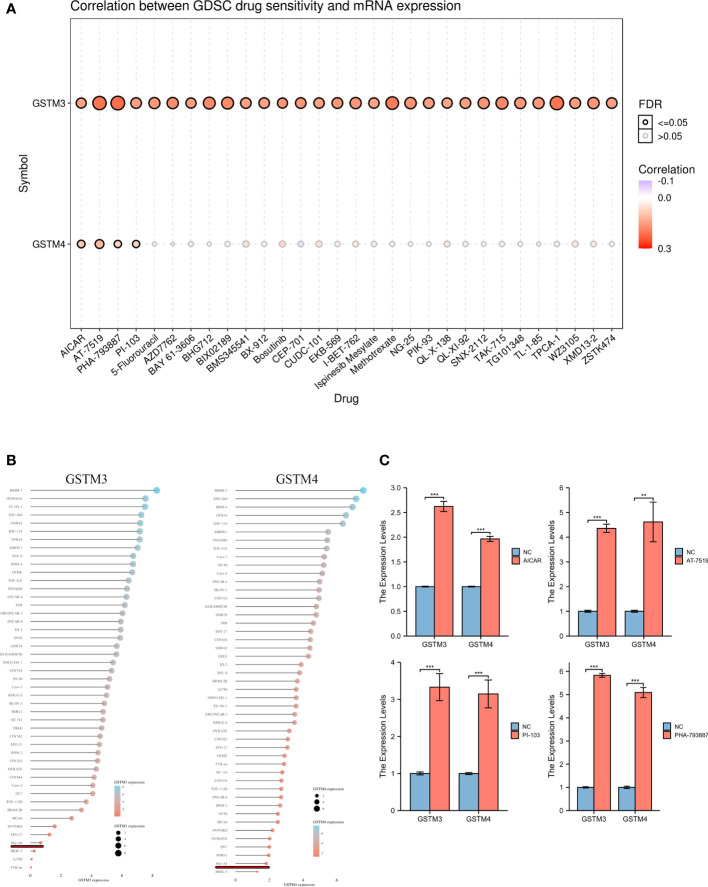
Methods: Data from multiple public databases associated with OC and GSTMs were collected. Expression, prognosis, function enrichment, immune infiltration, stemness index, and drug sensitivity analysis was utilized to identify the roles of GSTMs in OC progression. RT-qPCR analysis confirmed the effect of AICAR, AT-7519, PHA-793887 and PI-103 on the mRNA levels of GSTM3/4.
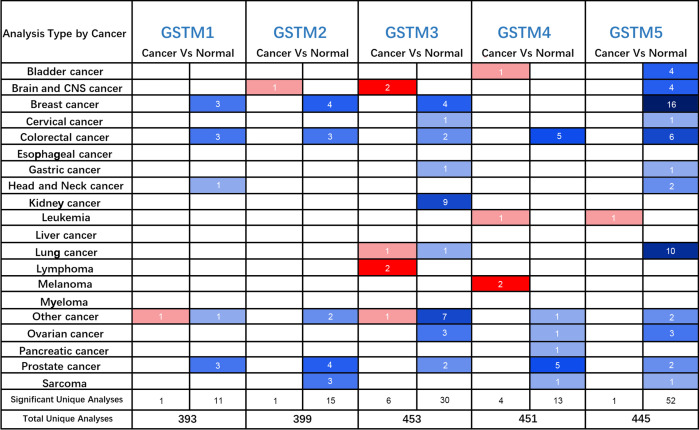
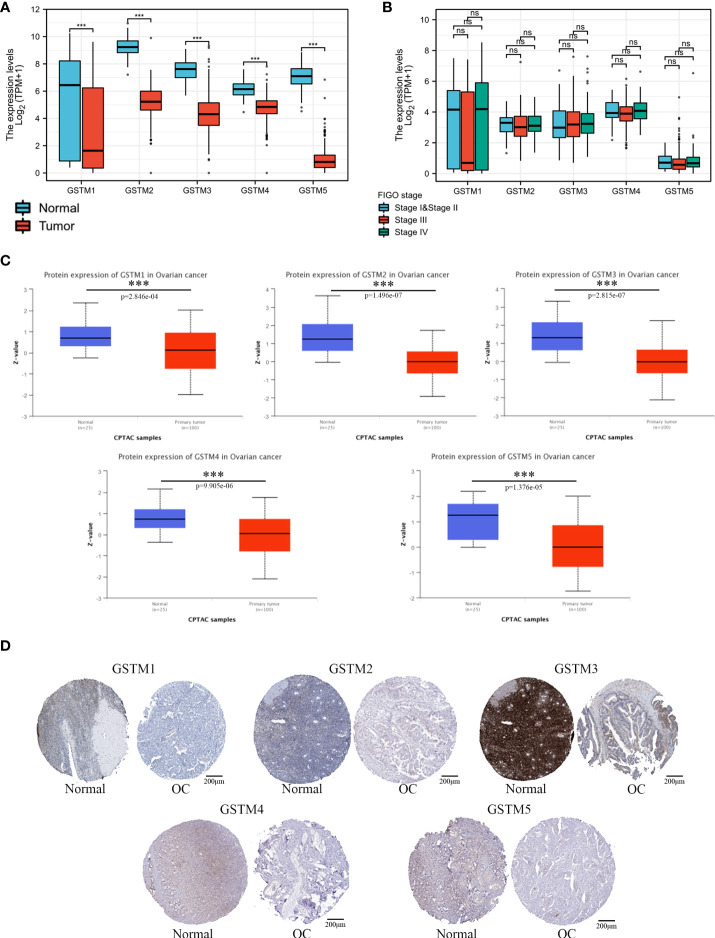
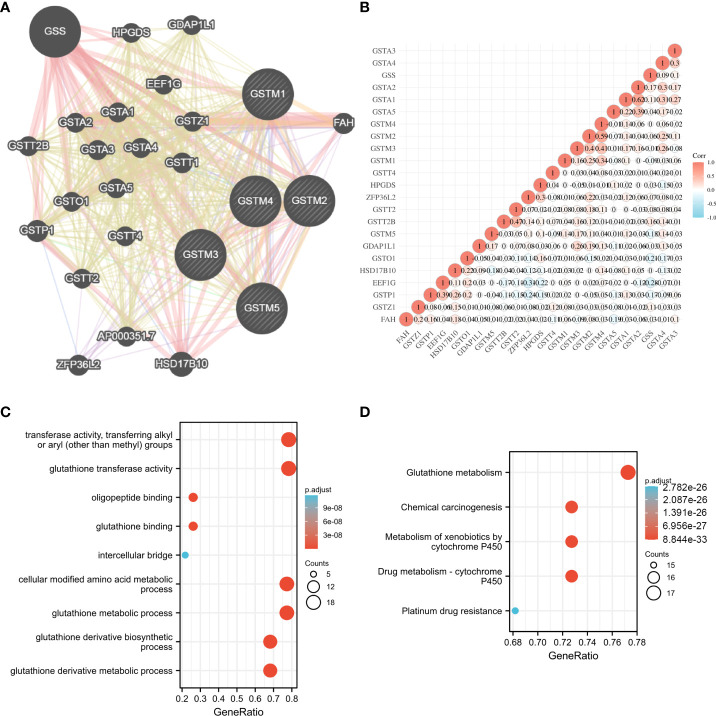
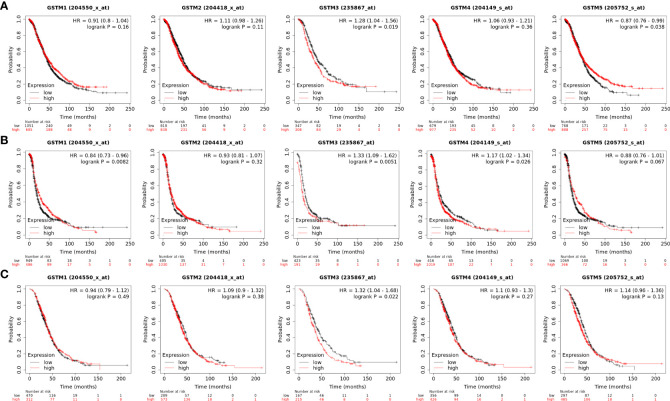
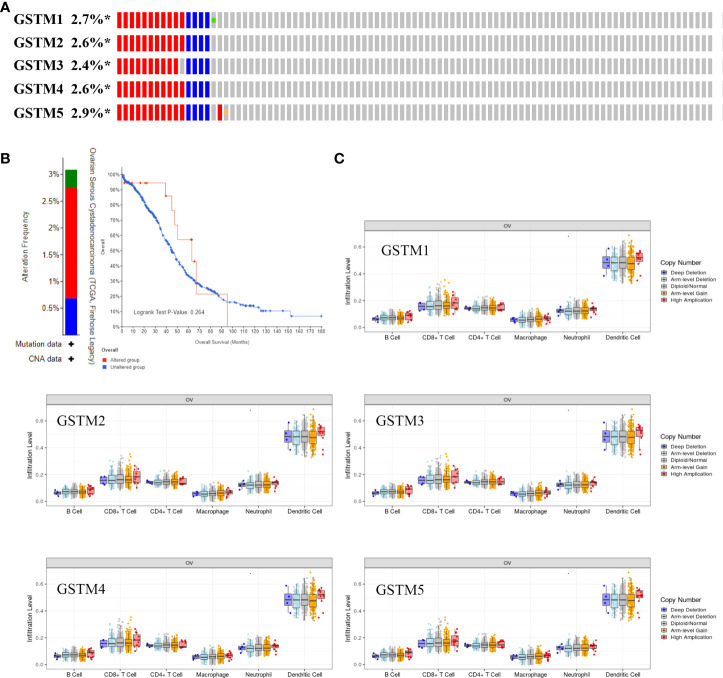
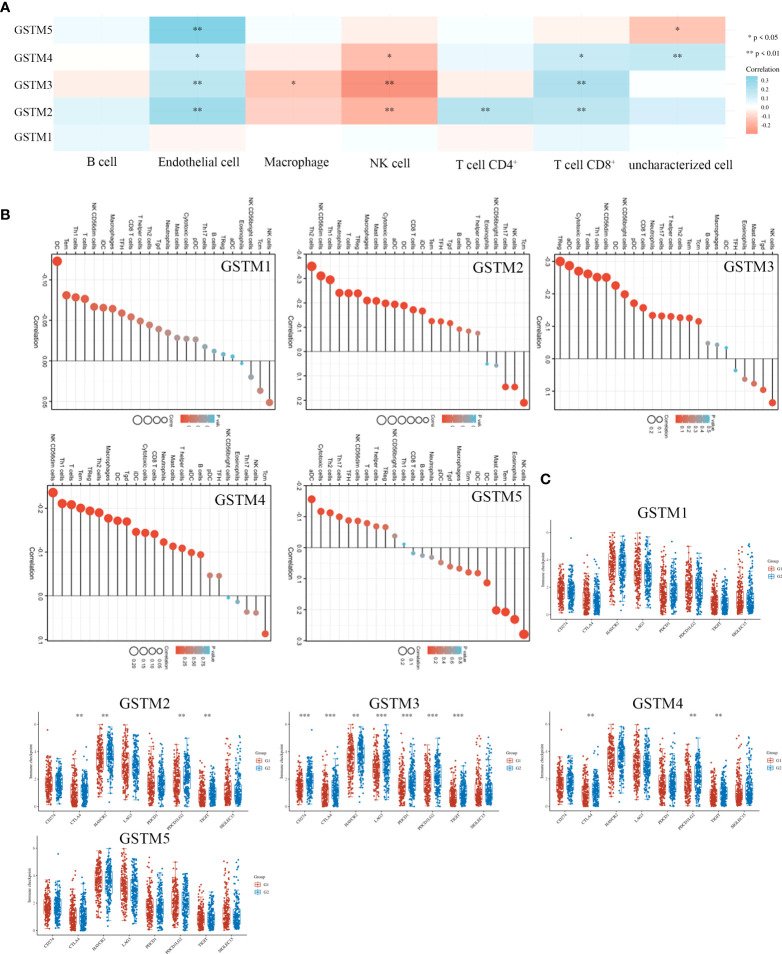
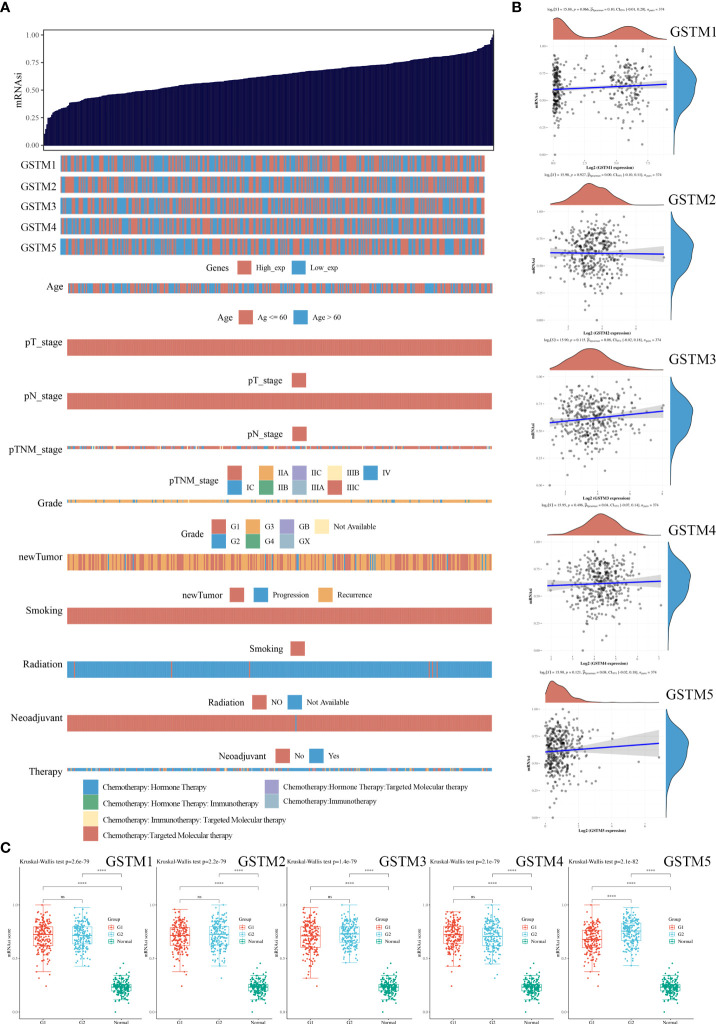
Results: GSTM1-5 were decreased in OC samples compared to normal ovary samples. GSTM1/5 were positively correlated with OC prognosis, but GSTM3 was negatively correlated with OC prognosis. Function enrichment analysis indicated GSTMs were involved in glutathione metabolism, drug metabolism, and drug resistance. Immune infiltration analysis indicated GSTM2/3/4 promoted immune escape in OC. GSTM5 was significantly correlated with OC stemness index. GSTM3/4 were remarkedly associated with OC chemoresistance, especially in AICAR, AT-7519, PHA-793887 and PI-103.
Conclusion: GSTM3 was negatively correlated with OC prognosis, and associated with OC chemoresistance and immune escape. This gene may serve as potential prognostic biomarkers and therapeutic target for OC patients.
Keywords: GSTM family; bioinformatic analysis; drug sensitivity; ovarian cancer; prognostic marker.
Copyright © 2022 Zhang, Li, Zou, Lai, Zeng, Peng, Zou, Cao, Liu, Zhu, Li and Li.
Conflict of interest statement
The authors declare that the research was conducted in the absence of any commercial or financial relationships that could be construed as a potential conflict of interest.
Figures
Similar articles
-
Comprehensive analysis of the prognostic value of glutathione S-transferases Mu family members in breast cancer.Cell Biol Int. 2024 Sep;48(9):1313-1325. doi: 10.1002/cbin.12195. Epub 2024 Jun 23. Cell Biol Int. 2024. PMID: 38922769
-
Genetic variants in GSTM3 gene within GSTM4-GSTM2-GSTM1-GSTM5-GSTM3 cluster influence breast cancer susceptibility depending on GSTM1.Breast Cancer Res Treat. 2010 Jun;121(2):485-96. doi: 10.1007/s10549-009-0585-9. Epub 2009 Oct 24. Breast Cancer Res Treat. 2010. PMID: 19856098
-
Identification and verification of the prognostic value of the glutathione S-transferase Mu genes in gastric cancer.Oncol Lett. 2020 Oct;20(4):100. doi: 10.3892/ol.2020.11961. Epub 2020 Aug 7. Oncol Lett. 2020. PMID: 32831919 Free PMC article.
-
Glutathione S-transferase polymorphisms and risk of ovarian cancer: a HuGE review.Genet Med. 2002 Jul-Aug;4(4):250-7. doi: 10.1097/00125817-200207000-00003. Genet Med. 2002. PMID: 12172391 Review.
-
Double Insurance for OC: miRNA-Mediated Platinum Resistance and Immune Escape.Front Immunol. 2021 Apr 1;12:641937. doi: 10.3389/fimmu.2021.641937. eCollection 2021. Front Immunol. 2021. PMID: 33868274 Free PMC article. Review.
Cited by
-
Weight Changes Are Linked to Adipose Tissue Genes in Overweight Women with Polycystic Ovary Syndrome.Int J Mol Sci. 2024 Oct 28;25(21):11566. doi: 10.3390/ijms252111566. Int J Mol Sci. 2024. PMID: 39519120 Free PMC article. Clinical Trial.
-
Identification of bromodomain-containing proteins prognostic value and expression significance based on a genomic landscape analysis of ovarian serous cystadenocarcinoma.Front Oncol. 2022 Oct 5;12:1021558. doi: 10.3389/fonc.2022.1021558. eCollection 2022. Front Oncol. 2022. PMID: 36276071 Free PMC article.
-
IGF2BP2 regulates the inflammation of fibroblast-like synoviocytes via GSTM5 in rheumatoid arthritis.Cell Death Discov. 2024 May 3;10(1):215. doi: 10.1038/s41420-024-01988-3. Cell Death Discov. 2024. PMID: 38702323 Free PMC article.
-
Pleural Mesothelioma: Treatable Traits of a Heterogeneous Disease.Cancers (Basel). 2023 Dec 6;15(24):5731. doi: 10.3390/cancers15245731. Cancers (Basel). 2023. PMID: 38136277 Free PMC article. Review.
-
A novel proteomic prognostic signature characterizes the immune landscape and predicts nasopharyngeal carcinoma prognosis.Heliyon. 2024 Sep 18;10(19):e37897. doi: 10.1016/j.heliyon.2024.e37897. eCollection 2024 Oct 15. Heliyon. 2024. PMID: 39386833 Free PMC article.
References
LinkOut - more resources
Full Text Sources
Research Materials
Miscellaneous