. 2022 Jul 28:12:967207.
doi: 10.3389/fonc.2022.967207. eCollection 2022.

Necroptosis-associated long noncoding RNAs can predict prognosis and differentiate between cold and hot tumors in ovarian cancer

Affiliations

Necroptosis-associated long noncoding RNAs can predict prognosis and differentiate between cold and hot tumors in ovarian cancer

Yi-Bo He et al. Front Oncol. .

Abstract

Objective: The mortality rate of ovarian cancer (OC) is the highest among all gynecologic cancers. To predict the prognosis and the efficacy of immunotherapy, we identified new biomarkers.

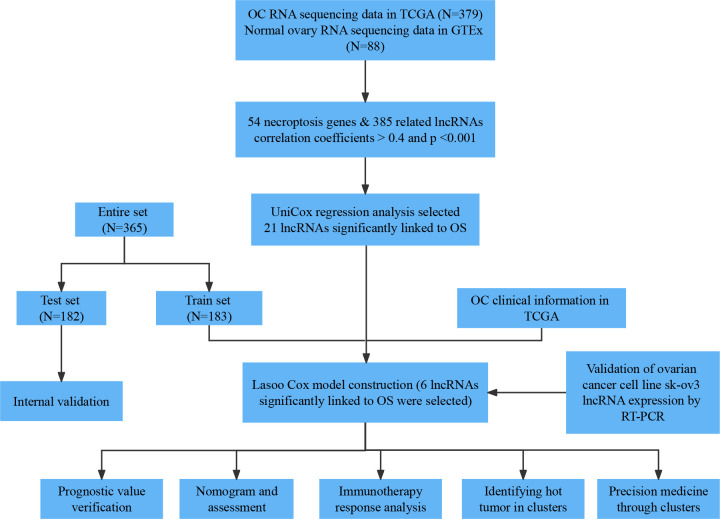
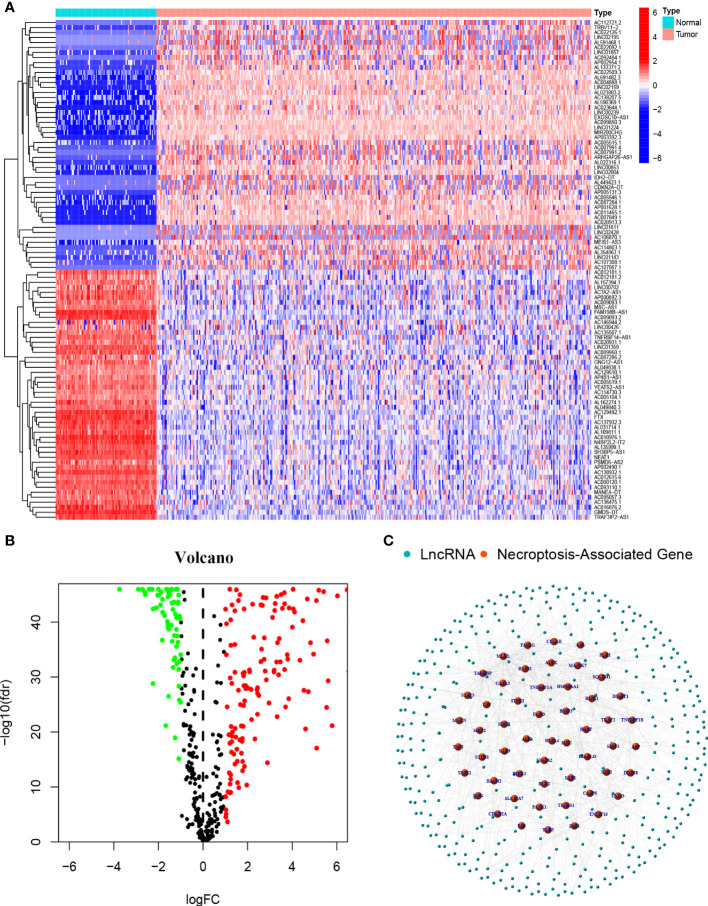
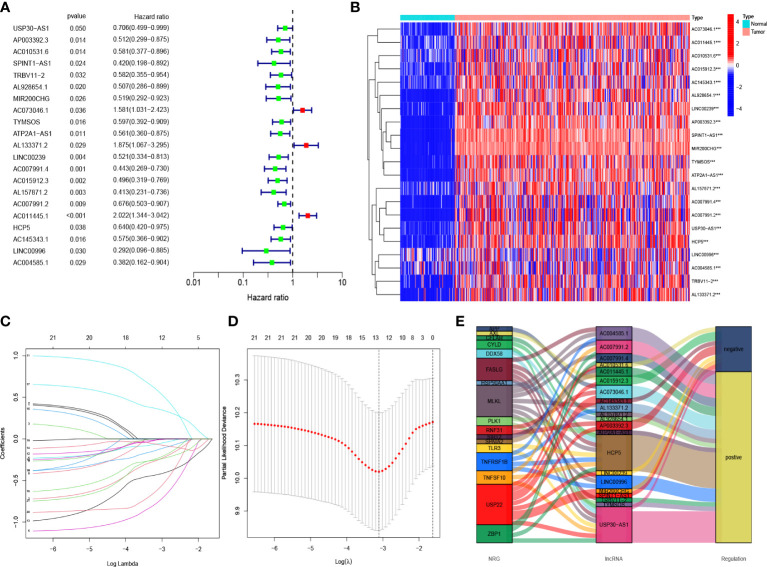
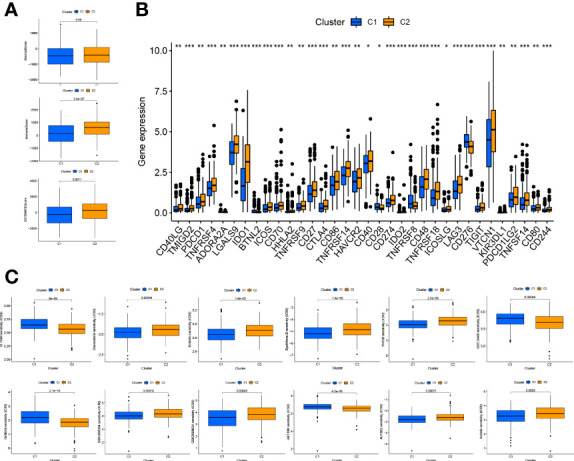
Methods: The Cancer Genome Atlas (TCGA) and the Genotype-Tissue Expression Project (GTEx) databases were used to extract ovarian cancer transcriptomes. By performing the co-expression analysis, we identified necroptosis-associated long noncoding RNAs (lncRNAs). We used the least absolute shrinkage and selection operator (LASSO) to build the risk model. The qRT-PCR assay was conducted to confirm the differential expression of lncRNAs in the ovarian cancer cell line SK-OV-3. Gene Set Enrichment Analysis, Kaplan-Meier analysis, and the nomogram were used to determine the lncRNAs model. Additionally, the risk model was estimated to evaluate the efficacy of immunotherapy and chemotherapy. We classified necroptosis-associated IncRNAs into two clusters to distinguish between cold and hot tumors.

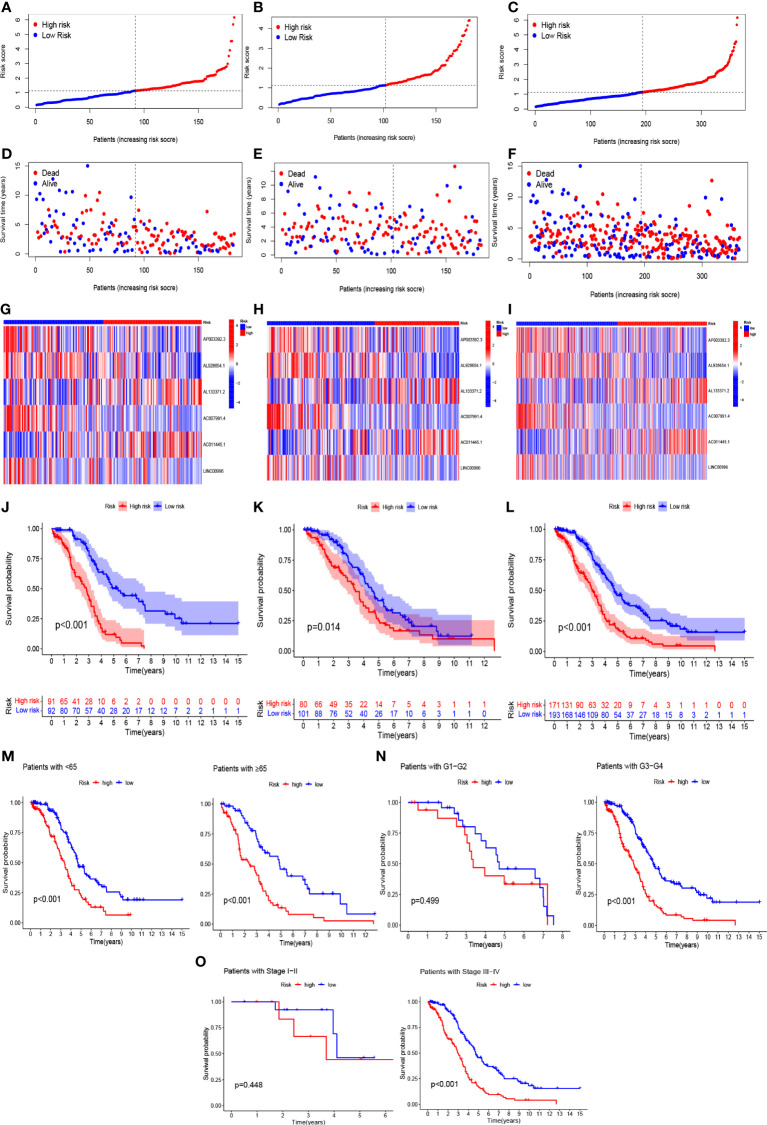
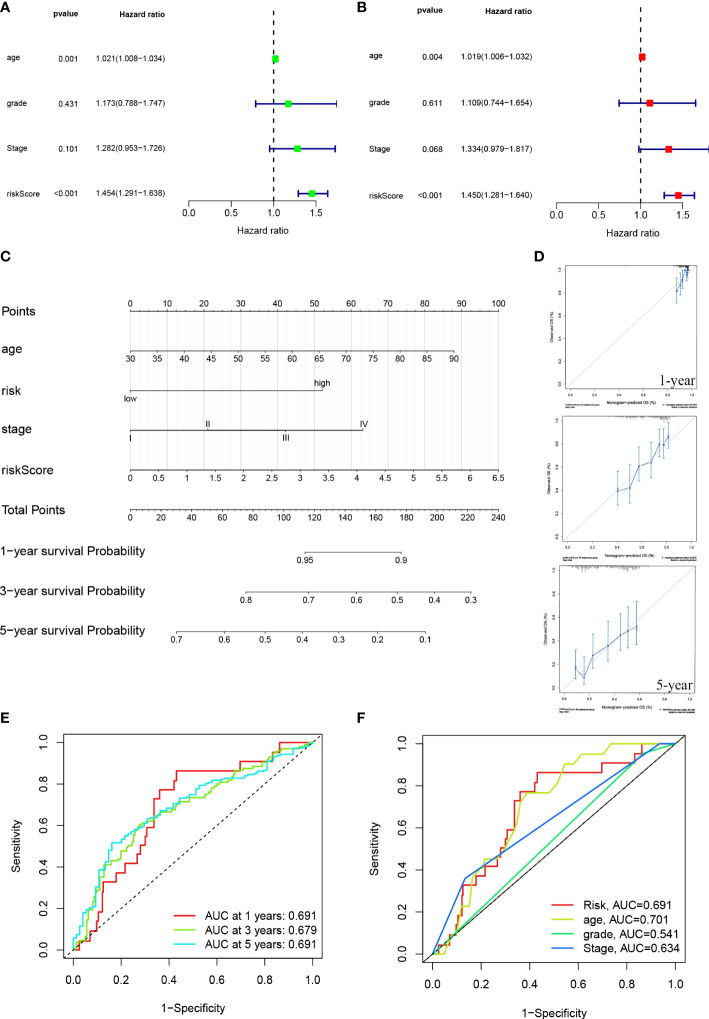
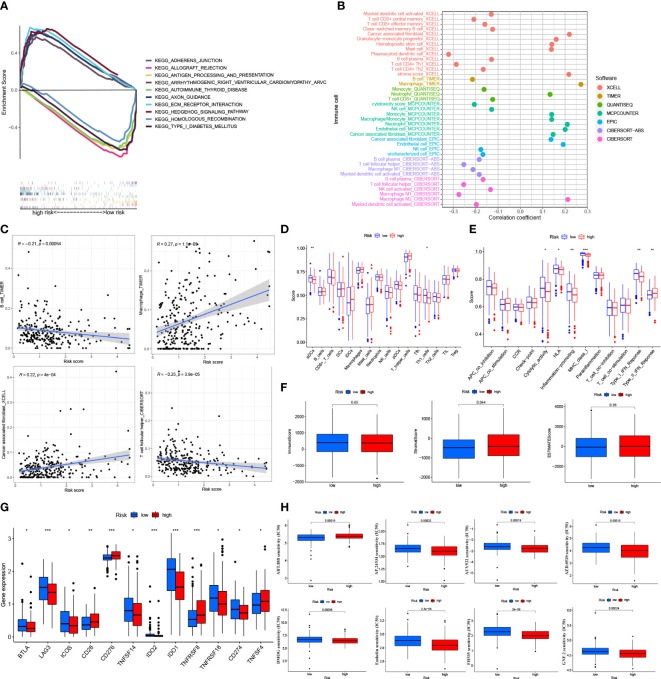
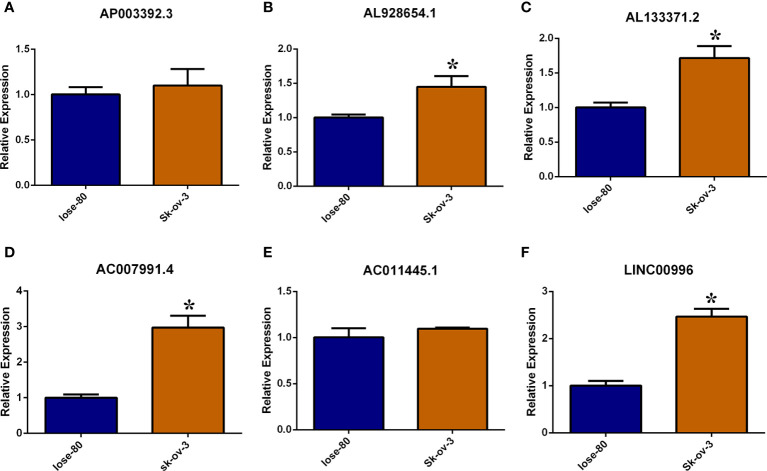
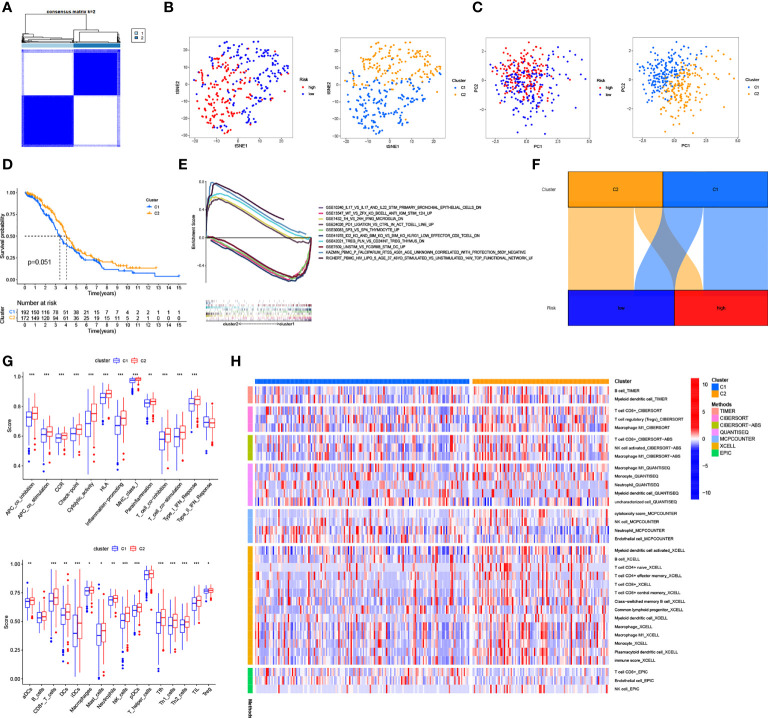
Results: The model was constructed using six necroptosis-associated lncRNAs. The calibration plots from the model showed good consistency with the prognostic predictions. The overall survival of one, three, and five-year areas under the ROC curve (AUC) was 0.691, 0.678, and 0.691, respectively. There were significant differences in the IC50 between the risk groups, which could serve as a guide to systemic treatment. The results of the qRT-PCR assay showed that AL928654.1, AL133371.2, AC007991.4, and LINC00996 were significantly higher in the SK-OV-3 cell line than in the Iose-80 cell line (P < 0.05). The clusters could be applied to differentiate between cold and hot tumors more accurately and assist in accurate mediation. Cluster 2 was more vulnerable to immunotherapies and was identified as the hot tumor.

Conclusion: Necroptosis-associated lncRNAs are reliable predictors of prognosis and can provide a treatment strategy by screening for hot tumors.

Keywords: TCGA; immunotherapy; long noncoding RNAs; necroptosis; ovarian cancer.


Conflict of interest statement

The authors declare that the research was conducted in the absence of any commercial or financial relationships that could be construed as a potential conflict of interest.

Figures

Figure 1
Figure 1
Flow chart of our research.
Figure 2
Figure 2
Necroptosis-associated Genes and lncRNAs screening in patients with OC (A) The heatmap of differentially expressed necroptosis-associated lncRNAs. (B) Volcano plot of 387 differentially expressed necroptosis-associated lncRNAs. (C) The network between necroptosis genes and lncRNAs (correlation coefficients>0.4 and p<0.001).
Figure 3
Figure 3
Risk prediction signature model in patients with OC (A) The prognostic lncRNAs obtained with uni-Cox regression analysis. (B) The heatmap of differentially expressed lncRNAs. (C) In the LASSO model, the 10-fold cross-validation for variable selection. (D) Cross-validation of error curves is performed with the tuning parameters (log λ) of patients’ OS-related lncRNAs. The imaginary perpendicular line is also dragged to the excellent value. (E) Necroptosis genes and lncRNAs are shown in the Sankey diagram.
Figure 4
Figure 4
In the train, test, and entire sets, the prognostic value of the model for six necroptosis-associated lncRNAs. (A–C) A model of necroptosis-associated lncRNAs according to risk score of the train, test, and entire sets is displayed, respectively. (D–F) Surviving time and survival status among low- and high-risk groups in the train, test, and overall sets. (G–I) The heat maps of 6 lncRNAs expression can be seen in the train, test, and overall set. (J–L) Overall survival of OC patients in the train, test, and entire sets between low- and high-risk groups, respectively (M–O) Survival curves of Kaplan–Meier of OS prognostic value based on age, grade, and stage between low- and high-risk groups in the entire set.
Figure 5
Figure 5
ROC diagram and nomogram for the risk model. (A, B) Uni-Cox and multi-Cox analyses of risk score and clinical Characteristics with OS. (C) The probability of the 1-, 3-, and 5-year OS was predicted by combining the nomogram with the risk, risk score, age, and stage. (D) The calibration curves for 1-, 3-, and 5-year OS. (E) The risk model’s 1-, 3-, and 5-year ROC curves. (F) Five-year ROC curves of risk score and clinical characteristics.
Figure 6
Figure 6
Tumor immune factors and drug sensitivity analysis in risk model (A) Kegg Pathway analysis between low- and high-risk. (B) The bubble plot of immune cells in the risk model. (C) The Relationship between immune cells and risk score (D). (E) The ssGSEA scores for immune cells and immune function in the risk groups. (F) The association of immune-related scores between low- and high-risk groups. (G) Immune checkpoints expression in risk groups. (H) Drug sensitive analysis in the risk model. *: p < 0.05. **: p < 0.01. ***: p < 0.0001.
Figure 7
Figure 7
Validate necroptosis-associated lncRNAs in risk model by RT-PCR method. (A–F) Relative expression of AP003392.3, AL928654.1, AL133371.2, AC007991.4 AC011445.1 and LINC00996 in Iose-80 and Sk-ov-3 cell line. *: p < 0.05.
Figure 8
Figure 8
Cold and Hot Tumor Cluster Screening. (A) According to ConsensusClusterPlus, OC patients are split into two clusters. (B) Risk groups and clusters of T-SNE. (C) The PCA for risk groups and clusters. (D) Survival curves of Kaplan–Meier for OS in clusters. (E) The GSEA of immunologic signature in clusters. (F) The Sankey diagram of risk groups and clusters. (G) The ssGSEA scores in clusters. (H) The heat map shows immune cells grouped in clusters. *: p < 0.05. **: p < 0.01. ***: p < 0.0001.
Figure 9
Figure 9
Immunoassay and drug sensitivity analysis in clusters (A) The relationship between immune-related scores in cluster1 and cluster2. (B) Immune checkpoints expression in risk groups. (C) Drug sensitive analysis in clusters. *: p < 0.05. **: p < 0.01. ***: p < 0.0001.

Similar articles

Cited by

References

    1. Meryet-Figuiere M, Lecerf C, Varin E, Coll JL, Louis MH, Dutoit S, et al. . Atelocollagen-mediated in vivo siRNA transfection in ovarian carcinoma is influenced by tumor site, siRNA target and administration route. Oncol Rep (2017) 38(4):1949–58. doi: 10.3892/or.2017.5882 - DOI - PMC - PubMed
    1. Wu H, Li R, Zhang Z, Jiang H, Ma H, Yuan C, et al. . Kallistatin inhibits tumour progression and platinum resistance in high-grade serous ovarian cancer. J Ovarian Res (2019) 12(1):125. doi: 10.1186/s13048-019-0601-6 - DOI - PMC - PubMed
    1. Vergote I, Trope CG, Amant F, Kristensen GB, Ehlen T, Johnson N, et al. . Neoadjuvant chemotherapy or primary surgery in stage IIIC or IV ovarian cancer. N Engl J Med (2010) 363(10):943–53. doi: 10.1056/NEJMoa0908806 - DOI - PubMed
    1. Koehn BH, Schoenberger SP. Tumor immunotherapy: making an immortal army. Nat Med (2009) 15(7):731–2. doi: 10.1038/nm0709-731 - DOI - PMC - PubMed
    1. Bersanelli M, Buti S. From targeting the tumor to targeting the immune system: Transversal challenges in oncology with the inhibition of the PD-1/PD-L1 axis. World J Clin Oncol (2017) 8(1):37–53. doi: 10.5306/wjco.v8.i1.37 - DOI - PMC - PubMed

LinkOut - more resources