. 2022 Aug 4:2022:4156966.
doi: 10.1155/2022/4156966. eCollection 2022.

The Long Noncoding Transcript HNSCAT1 Activates KRT80 and Triggers Therapeutic Efficacy in Head and Neck Squamous Cell Carcinoma

Affiliations

The Long Noncoding Transcript HNSCAT1 Activates KRT80 and Triggers Therapeutic Efficacy in Head and Neck Squamous Cell Carcinoma

Yixuan Zhao et al. Oxid Med Cell Longev. .

Abstract

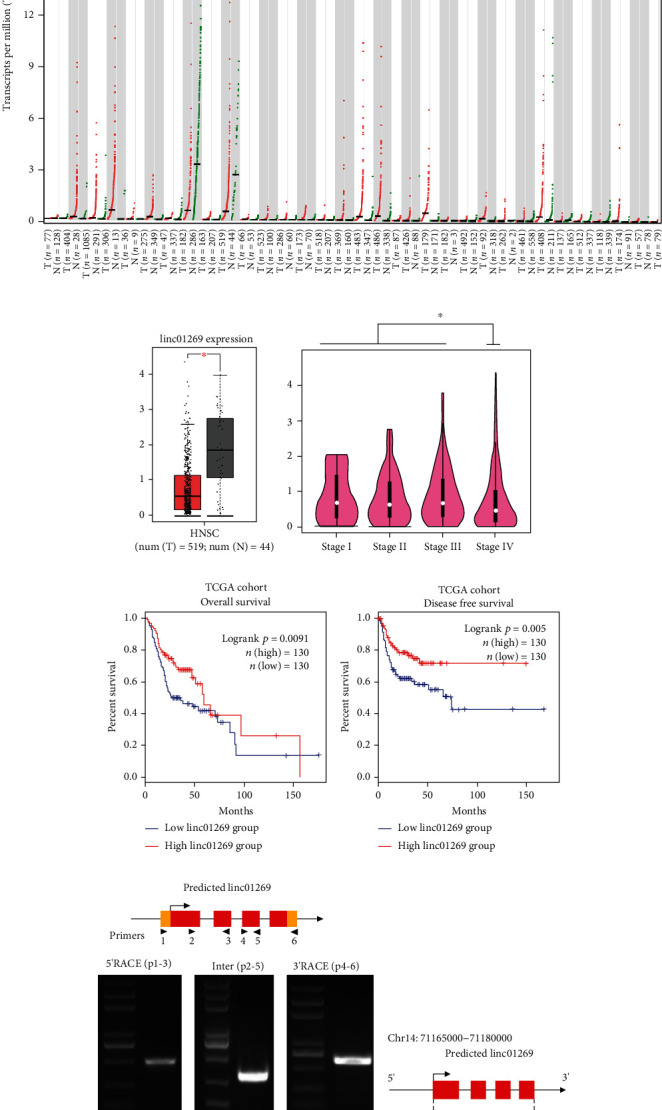
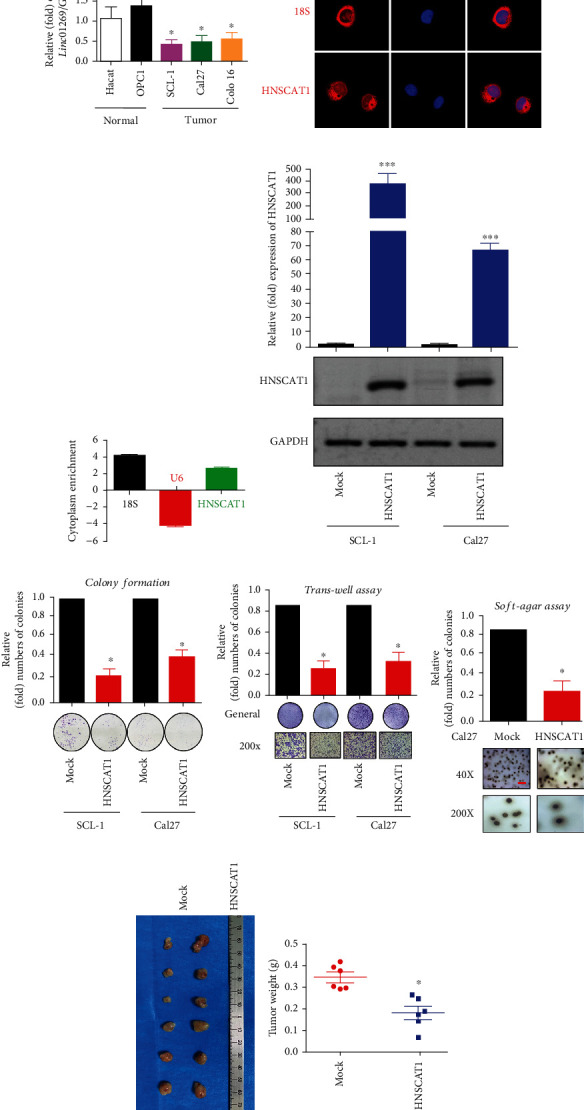
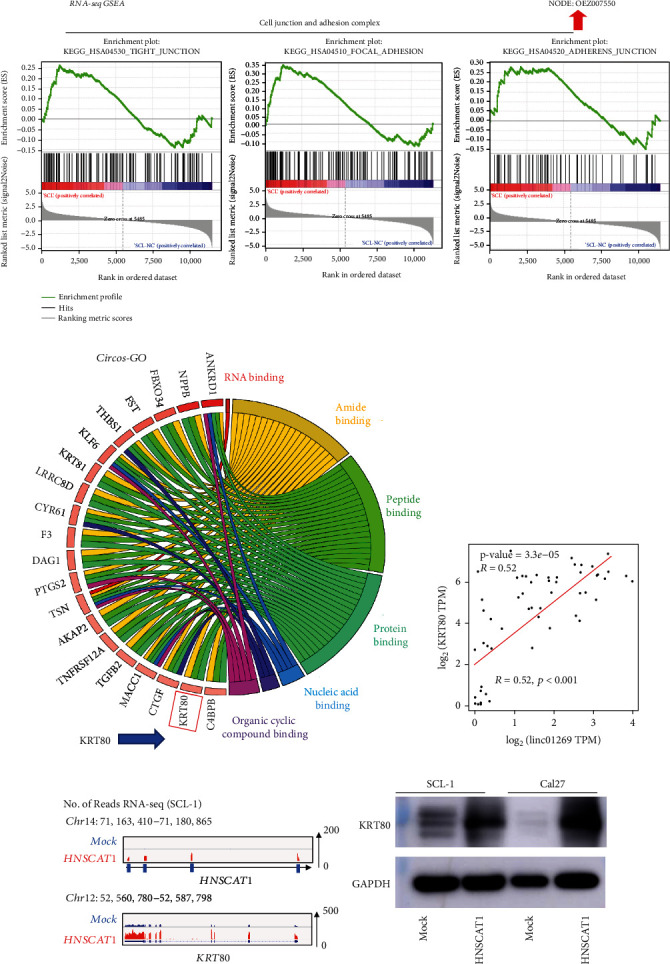
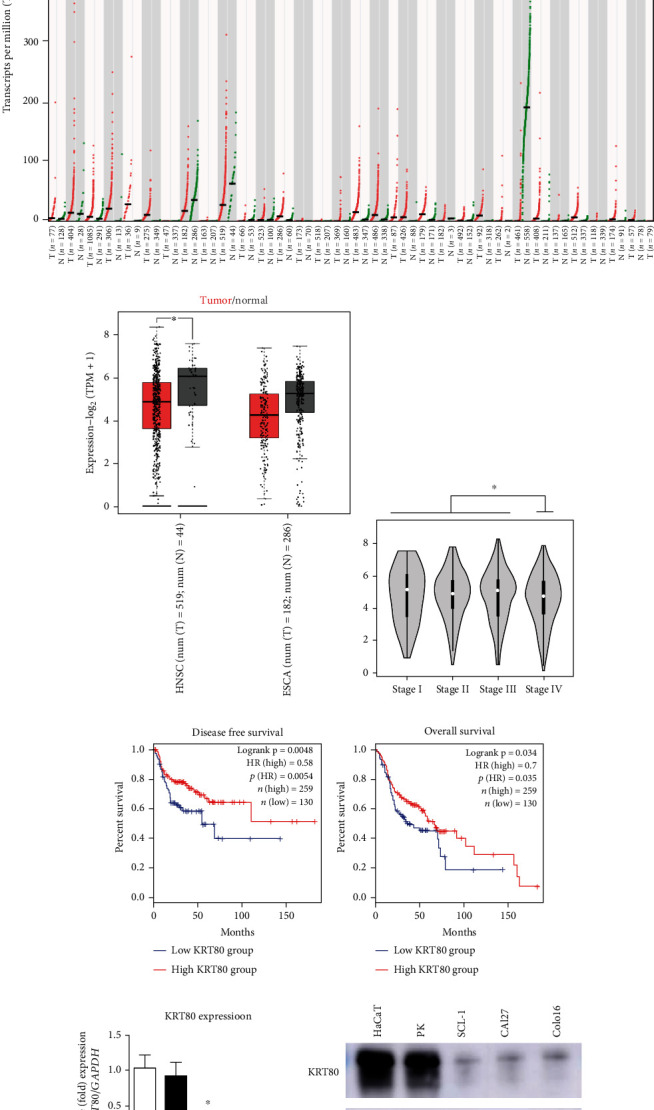
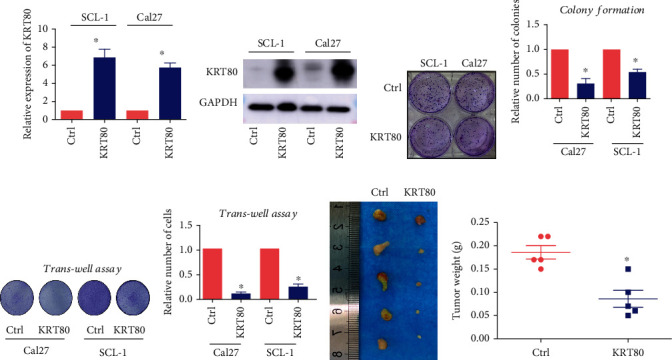
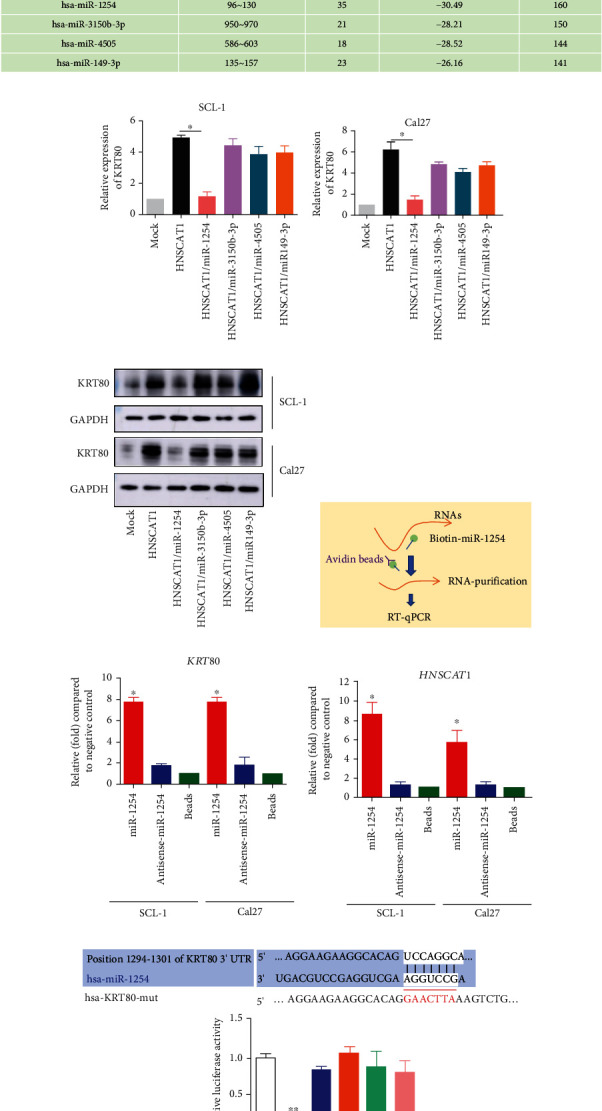
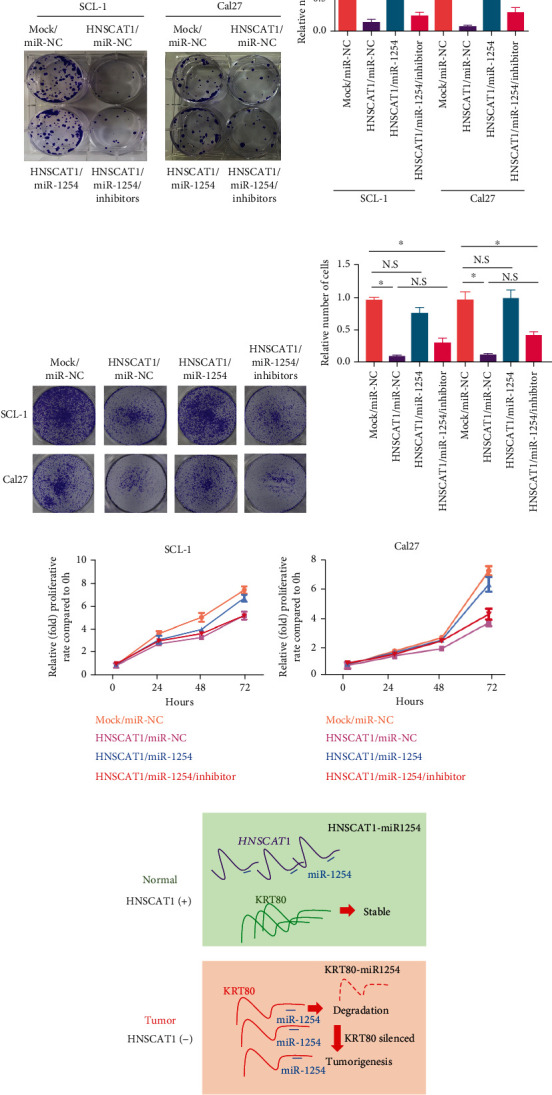
Head and neck squamous carcinoma (HNSC) is the most prevalent malignancy of the head and neck regions. Long noncoding RNAs (lncRNAs) are vital in tumorigenesis regulation. However, the role of lncRNAs in HNSC requires further exploration. Herein, through bioinformatic assays using The Cancer Genome Atlas (TCGA) datasets, rapid amplification of cDNA ends (RACE) assays, and RNA-FISH, we revealed that a novel cytoplasmic transcript, HNSC-associated transcript 1 (HNSCAT1, previously recognized as linc01269), was downregulated in tumor samples and advanced tumor stages and was also associated with favorable outcomes in HNSC. Overexpression of HNSCAT1 triggered treatment efficacy in HNSCs both in vivo and in vitro. More importantly, through high-throughput transcriptome analysis (RNA-seq, in NODE database, OEZ007550), we identified KRT80, a tumor suppressor in HNSC, as the target of HNSCAT1. KRT80 expression was modulated by lncRNA HNSCAT1 and presented a positive correlation in tumor samples (R = 0.52, p < 0.001). Intriguingly, we identified that miR-1245 simultaneously interacts with KRT80 and HNSCAT1, which bridges the regulatory function between KRT80 and HNSCAT1. Conclusively, our study demonstrated that lncRNA HNSCAT1 functions as a necessary tumor inhibitor in HNSC, which provides a novel mechanism of lncRNA function and provides alternative targets for the diagnosis and treatment of HNSC.


Conflict of interest statement

The authors declare that they have no competing interests.

Figures

Figure 1
Figure 1
HNSCAT1 is downregulated in HNSC. (a) Pancancer analysis of RNA expression of linc01269 in TCGA database. (b) Expression of linc01269 in HNSC and normal samples. These data were acquired from GEPIA2 (http://gepia2.cancer-pku.cn). Significance was assessed by unpaired two-tailed Student's t-test. p < 0.05. (c) Stage IV HNSC samples presented the lowest linc01269 expression level. The figure was generated on the GEPIA2 website (http://gepia2.cancer-pku.cn). Significance was assessed by unpaired two-tailed Student's t-test. p < 0.05. (d, e) Elevated linc01269 expression was associated with favorable outcomes in terms of both (d) overall survival (log-rank p = 0.0091) and (e) disease-free survival (log-rank p = 0.005). (f, g) RACE assay for the identification of full-length linc01269. The novel transcript harbors a 166 bp extension in the 5′ terminus and a 303 bp extension in the 3′ terminus.
Figure 2
Figure 2
HNSCAT1 serves as a negative regulator of HNSC. (a) Real-time PCR revealed that lincRNA HNSCAT1 was downregulated in HNSC cell lines. HaCaT cells and primary keratinocytes (PK) served as normal controls. The value of HaCaT was set to 1. Data are presented as the means ± SD of three biological replicates. Significance was assessed by unpaired two-tailed Student's t-test. p < 0.05. (b) RNA-FISH indicated that HNSCAT1 RNA was mainly distributed in the cytoplasm. (c) A nuclear-cytoplasmic RNA extraction assay was performed. Real-time PCR was performed to identify RNA distribution. U6 served as the nuclear control, while 18S was the cytoplasmic control. (d) Real-time PCR was performed to examine the overexpression efficacy of HNSCAT1 in SCL-1 and Cal27 cells. Data are presented as the means ± SD of three biological replicates. Significance was assessed by unpaired two-tailed Student's t-test. ∗∗∗p < 0.001. (e) Colony formation assays were conducted to determine proliferative capacity after overexpression of lincRNA HNSCAT1 in SCL-1 and Cal27 cells. Data are presented as the means ± SD of three biological replicates. Significance was assessed by unpaired two-tailed Student's t-test. p < 0.05. (f) Transwell assays showed that migration was impaired after the restoration of lincRNA HNSCAT1 in SCL-1 and Cal27 cells. Data are presented as the means ± SD of three biological replicates. Significance was assessed by unpaired two-tailed Student's t-test. p < 0.05. (g) A soft-agar colony formation assay was conducted to determine colony formation capacity after overexpression of lincRNA HNSCAT1 in Cal27 cells. Data are presented as the means ± SD of three biological replicates. Significance was assessed by unpaired two-tailed Student's t-test. p < 0.05. (h) Subcutaneous xenografts were established in HNSCAT1-overexpressing and control cells. N = 6 for each group. (i) Tumor weight in each xenograft. p < 0.05. Experiments were conducted in triplicate, and the results are shown as the mean ± SEM. p < 0.05.
Figure 3
Figure 3
KRT80 was upregulated after overexpression of HNSCAT1. (a) GSEA was performed based on RNA-seq results after overexpression of HNSCAT1. Notably, cell junction- and adhesion complex-related signaling pathways were significantly upregulated in HNSCAT1-overexpressing cells. (b) A Circos analysis was performed and revealed that KRT80 mRNA expression was elevated. KRT80 is relevant for protein binding, peptide binding, and amide binding and may serve as an important regulator in cell junction and adhesion. (c) A robust correlation between KRT80 and linc01269 (R = 0.52, p < 0.001) was observed in HNSC samples. These data were acquired from GEPIA2 (http://gepia2.cancer-pku.cn), and the data were obtained from TCGA database. (d) RNA-seq revealed that lncHNSCAT1 was upregulated, which resulted in the upregulation of KRT80. (e) Western blotting confirmed that KRT80 was upregulated after HNSCAT1 was overexpressed in SCL-1 and Cal27 cells. GAPDH served as a control.
Figure 4
Figure 4
KRT80 is downregulated in HNSC cells. (a) Pancancer analysis of KRT80 RNA expression in TCGA database. (b) Expression of KRT80 in HNSC and normal samples. These data were acquired from GEPIA2 (http://gepia2.cancer-pku.cn). (c) KRT80 presented lower expression in stage IV HNSC samples than in early-stage HNSC samples. (d, e) Elevated KRT80 expression was associated with favorable outcomes in terms of both (d) disease-free survival (log-rank p = 0.0048) and (e) overall survival (log-rank p = 0.034). (f) Real-time PCR revealed that KRT80 was downregulated in HNSC cell lines. HaCaT cells and primary keratinocytes (PK) served as normal controls. The value of HaCaT cells was set to 1. Experiments were conducted in triplicate, and the results are shown as the mean ± SEM. p < 0.05. (g) Western blotting assays demonstrated that KRT80 protein was upregulated in HNSC cells (lanes 3, 4, and 5) compared to normal control cells (lanes 1 and 2).
Figure 5
Figure 5
KRT80 serves as a tumor suppressor in HNSC cells. (a) Real-time PCR was conducted to evaluate KRT80 expression after overexpressing KRT80 in SCL-1 and Cal27 cells. (b) Western blotting assays showed that KRT80 protein was increased after overexpression in SCL-1 and Cal27 cells. (c, d) Colony formation assays were conducted to evaluate proliferation capacity after KRT80 overexpression in SCL-1 and Cal27 cells. Experiments were conducted in triplicate, and the results are shown as the mean ± SEM. p < 0.05. (e, f) Transwell assays showed that migration was impaired in KRT80-overexpressing SCL-1 and Cal27 cells. Experiments were conducted in triplicate, and the results are shown as the mean ± SEM. p < 0.05. (g, h) Subcutaneous xenografts were established in (g) KRT80-overexpressing and control cells. N = 5 for each group. (h) Tumor weight in each xenograft. p < 0.05.
Figure 6
Figure 6
hsa-miR-1254 binds KRT80 and HNSCAT1. (a) Through TargetScan and miRDB, we found 268 miRNAs that may serve as binding candidates for HNSCAT1. Notably, 4 of them (miR-1254, miR-3150b-3p, miR-4505, and miR-149-3p) were predicted to interact with the 3′UTR of KRT80 mRNA. (b, c) Real-time PCR was performed to observe KRT80 expression after transfecting miRNA mimics (miR-1254, miR-3150b-3p, miR-4505, and miR-149-3p) into HNSCAT1-overexpressing cells. Experiments were conducted in triplicate, and the results are shown as the mean ± SEM. p < 0.05. (d) Western blotting assays were conducted to observe KRT80 protein levels after transfecting miRNA mimics into HNSCAT1-overexpressing cells. (e) Schematic figure of the miRNA-binding RNA capture assay. (f, g) Real-time PCR was performed on these miRNA-binding RNAs. The miRNA probe transfection-free group (beads group) was set to 1. These results indicated that miR-1254 interacts with (f) KRT80 and (g) lincRNA HNSCAT1. (h) A reporter gene assay demonstrated that miR-1254 mimics significantly inhibited reporter activity, while the miRNA potential binding site-mutated group (lanes 4-6) and miR-1254 inhibitor-treated group (lane 3) presented similar reporter signals compared to the control group. Experiments were conducted in triplicate, and the results are shown as the mean ± SEM. p < 0.05.
Figure 7
Figure 7
miR-1254 promotes HNSC malignant behavior by inhibiting KRT80. (a, b) Colony formation assays were performed to determine proliferation capacity after overexpressing miRNA-1254 in SCL-1 and Cal27 cells. Experiments were conducted in triplicate, and the results are shown as the mean ± SEM. p < 0.05. (c, d) Transwell assays showed that the migration ability was impaired after overexpressing miRNA-1254 in SCL-1 and Cal27 cells. All of the experiments were performed in triplicate and are presented as the mean ± SEM. p < 0.05. (e, f) The CCK-8 assay indicated that the cell growth inhibition effect after HNSCAT1 overexpression was largely rescued when miR-1254 was reintroduced; however, the rescue efficacy was diminished after the addition of extra miR-1254 inhibitors in both (e) SCL-1 and (f) Cal27 cells. (g) Proposed mechanism of the lncRNA HNSCAT1/miR-1254/KRT80 axis in HNSC. HNSCAT1 could interact with miR-1254 and thereby prevent miR-1254-mediated KRT80 degradation. lncHNSCAT1 and KRT80 serve as important tumor suppressors in HNSC.

Similar articles

Cited by

References

    1. Loganathan S. K., Schleicher K., Malik A., et al. Rare driver mutations in head and neck squamous cell carcinomas converge on NOTCH signaling. Science . 2020;367(6483):1264–1269. doi: 10.1126/science.aax0902. - DOI - PubMed
    1. Paver E. C., Currie A. M., Gupta R., Dahlstrom J. E. Human papilloma virus related squamous cell carcinomas of the head and neck: diagnosis, clinical implications and detection of HPV. Pathology . 2020;52(2):179–191. doi: 10.1016/j.pathol.2019.10.008. - DOI - PubMed
    1. Valenti F., Sacconi A., Ganci F., et al. The miR-205-5p/BRCA1/RAD17 axis promotes genomic instability in head and neck squamous cell carcinomas. Cancers . 2019;11(9):p. 1347. doi: 10.3390/cancers11091347. - DOI - PMC - PubMed
    1. Zheng W., Zhu Y., Chen X., Zhao J. CD73 expression in myeloid-derived suppressor cells is correlated with clinical stages in head and neck squamous cell carcinomas. Annals of Translational Medicine . 2021;9(14):p. 1148. doi: 10.21037/atm-21-2589. - DOI - PMC - PubMed
    1. Ueki Y., Saito K., Iioka H., et al. PLOD2 Is Essential to Functional Activation of Integrin β1 for Invasion/Metastasis in Head and Neck Squamous Cell Carcinomas. iScience . 2020;23(2):p. 100850. doi: 10.1016/j.isci.2020.100850. - DOI - PMC - PubMed

MeSH terms

Substances