Review
. 2022 Jul 28:16:934266.
doi: 10.3389/fnsys.2022.934266. eCollection 2022.

Simultaneous electroencephalography-functional magnetic resonance imaging for assessment of human brain function

Affiliations
Review

Simultaneous electroencephalography-functional magnetic resonance imaging for assessment of human brain function

Elias Ebrahimzadeh et al. Front Syst Neurosci. .

Abstract

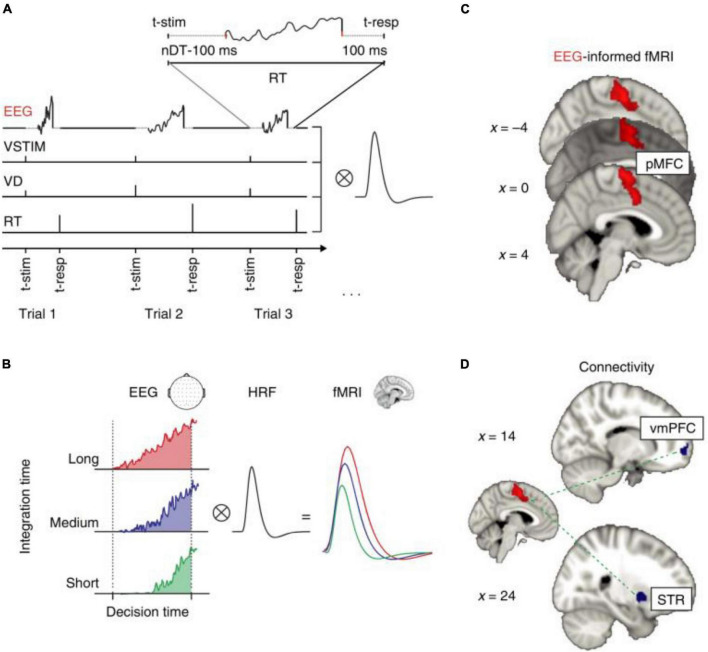
Electroencephalography (EEG) and functional Magnetic Resonance Imaging (MRI) have long been used as tools to examine brain activity. Since both methods are very sensitive to changes of synaptic activity, simultaneous recording of EEG and fMRI can provide both high temporal and spatial resolution. Therefore, the two modalities are now integrated into a hybrid tool, EEG-fMRI, which encapsulates the useful properties of the two. Among other benefits, EEG-fMRI can contribute to a better understanding of brain connectivity and networks. This review lays its focus on the methodologies applied in performing EEG-fMRI studies, namely techniques used for the recording of EEG inside the scanner, artifact removal, and statistical analysis of the fMRI signal. We will investigate simultaneous resting-state and task-based EEG-fMRI studies and discuss their clinical and technological perspectives. Moreover, it is established that the brain regions affected by a task-based neural activity might not be limited to the regions in which they have been initiated. Advanced methods can help reveal the regions responsible for or affected by a developed neural network. Therefore, we have also looked into studies related to characterization of structure and dynamics of brain networks. The reviewed literature suggests that EEG-fMRI can provide valuable complementary information about brain neural networks and functions.

Keywords: cognitive neural networks; functional connectivity; functional neurological disorders; multimodal image analysis; simultaneous EEG-fMRI.


Conflict of interest statement

The authors declare that the research was conducted in the absence of any commercial or financial relationships that could be construed as a potential conflict of interest.

Figures

FIGURE 1
FIGURE 1
PRISMA flowchart showing the classification of the extracted articles related to the functional neurological assessment by simultaneous EEG-fMRI recording.
FIGURE 2
FIGURE 2
An EEG power spectrum of a 23-year-old healthy volunteer. It presents a topographic representation of each power-band activity in detail. The data obtained from 19-channel MitsarEEG-202 device. The activations are shown in jet color map.
FIGURE 3
FIGURE 3
The illustration of three epileptic foci (in each row) for three different patients with refractory focal epilepsy which are localized by functional connectivity analysis on fMRI data. The patient in the top had their seizure focus localized in frontal right; the one in the middle showed epileptic activation originated in fronto-temporal left; and the one in the bottom was predicted to have their epileptic focus in parietal right. The activation regions with t-values from 3.1 to 4.5 are shown in red-yellow color map. A, Anterior; I, inferior; L, Left; P, Posterior; R, Right; S, Superior (Sadjadi et al., 2022).
FIGURE 4
FIGURE 4
“Primary sensorimotor area activation. (a) Rendering of the segmented head of subject 3, view from left and above. The segmented left and right central sulci are shown in gray. Current density map (maximum in yellow, minimum in black, linear scale shown on the left) at EMG onset is shown embedded in the section of the segmented head. fMRI-activated volume is shown in turquoise. The lateral maximum of cortical current density corresponds to the fMRI activation of the hand area of the left primary sensorimotor cortex and the medial current density maximum corresponds to the fMRI activation of the frontal medial wall motor areas. (b) Magnification of the hand area of the left primary sensorimotor area as shown in (a). The individual current vectors of the CCD source are displayed, whereas in the current density map in (a) only the absolute values of the currents are visualized. In their sum they are equivalent to the current density source at EMG onset shown in (a). The currents point in an anterior direction, consistent with activation of MI in the anterior bank of the central sulcus (Kristeva-Feige et al., 1994). (c) Current vectors in the same area as in (b) are shown 70 ms after EMG onset. The currents point in a posterior direction, consistent with activation of SI in the posterior bank of the central sulcus (Kristeva-Feige et al., 1994).”(Ball et al., 1999)—reprinted from (Kristeva-Feige et al., 1994) with permission.
FIGURE 5
FIGURE 5
Number of papers published per year on simultaneous EEG-fMRI. These data came from Pubmed site by searching for “Simultaneous EEG-fMRI” in Title/Abstract.
FIGURE 6
FIGURE 6
A sample of EEG signals recorded inside the scanner: (Left) primary signal; (Middle) after eliminating the MR gradient artifact; (Right) after removing the BCG artifact (Ebrahimzadeh et al., 2021b).
FIGURE 7
FIGURE 7
A bar chart illustrating the proportion of simultaneous EEG-fMRI studies in relation to neuropsychological impairments compared with each other in a way that shows the contribution of each neurological disorder in EEG-fMRI studies.
FIGURE 8
FIGURE 8
Simultaneous EEG-fMRI analysis on a patient with focal epilepsy in order to localize the seizure onset zone (SOZ). (A) Simultaneously recorded raw EEG data. (B) The EEG data after artifact removal. (C) The epilepsy-related component time series obtained using Independent Component Analysis (ICA) algorithm. (D) The 3D map of the candidate component. The active area is marked by yellow-red color. (E) The result of dipole localization of the identified generator in deep brain structures. (F) The final result of localizing the SOZ applying simultaneous analysis of EEG–fMRI (Ebrahimzadeh et al., 2019, 2019a).
FIGURE 9
FIGURE 9
“EEG-informed fMRI and connectivity analyses in the value-based task. (A) The fMRI GLM model included an EEG-informed regressor capturing the electrophysiological trial-by-trial dynamics of the process of evidence accumulation (EA) in each participant. Three actual single-trial EEG traces are shown. The traces cover the entire trial excluding the time intervals accounting for stimulus processing and motor execution (see inset and Methods for details). To absorb the variance associated with other task-related processes we included three additional regressors: VSTIM—an unmodulated stick function regressor at the onset of the stimuli, VD—a stick function regressor at the onset of stimuli that was parametrically modulated by the value difference between the decision alternatives and RT—a stick function regressor aligned at the time of response and modulated by RT. (B) Hypothetical EA traces in response-locked EEG activity ramping up with different accumulation rates. Convolving these traces with a hemodynamic response function (HRF) leads to higher predicted fMRI activity for longer compared to shorter integration times (that is, the predicted fMRI response scales with the area under each EA trace). (C) The EEG-informed fMRI predictor of the process of EA revealed an activation in pMFC. (D) PPI analysis using the pMFC cluster identified in c as a seed revealed an inverse coupling with a region of the vmPFC and the STR. All activations represent mixed-effects and are rendered on the standard MNI brain at |Z| 42.57, cluster-corrected using a resampling procedure (minimum cluster size, 76 voxels)” (Pisauro et al., 2017).
FIGURE 10
FIGURE 10
“EEG-informed fMRI analysis in an auditory choice reaction task.” (A) EEG single-trial data of a typical data set at electrode Cz. In many trials, a GBR between 30 and 100 ms post-stimulus is present. However, the amplitudes of the GBR are variable over time. This variability can be used for specific predictions of the related BOLD signal. In the lower part of the figure, the corresponding averaged GBR is shown. (B) GBR-specific BOLD activation based on the single-trial coupling of GBR amplitude variation and the corresponding BOLD activation. Activations can be seen in the left auditory cortex (gyrus temporalis superior, Brodmann area 41/22, highest t-value 8.3), the thalamus (highest t-value 7.6) and the anterior cingulate cortex (Brodmann area 24, highest t-value 10.1). In the lower right corner, a glass brain view is provided, demonstrating a 3D view of the three abovementioned clusters. Activations are shown at P. (Mulert et al., 2010).
FIGURE 11
FIGURE 11
Source analysis using EEG-informed fMRI approach in a 26-year-old woman with frontal lobe epilepsy (FLE) which demonstrates a neocortical activation in the inferior frontal gyrus. Top, the component identified on scalp EEG is shown which is located in the left frontotemporal lobe (left) and the dipole localization of the identified generator in deep brain structures (right). Middle, scalp recorded EEG with marked events on F3, F5, and F7. Bottom, Localization of the generator applying simultaneous analysis of EEG-fMRI. The active area is marked with a yellow-red color (Ebrahimzadeh et al., 2021b).
FIGURE 12
FIGURE 12
PET images of the healthy control (top row) and schizophrenic patient (bottom row) acquired during the first resting state measurement (Neuner et al., 2019).
FIGURE 13
FIGURE 13
fMRI Degree Centrality (DC) values of healthy control (top row) and schizophrenic patient (bottom row) during first resting state measurement. The DC values are overlaid on the MNI template. DC is one of the data driven functional connectivity measures and is computed using rs-fMRI data from both the healthy control and the schizophrenic patient (Neuner et al., 2019).

References

    1. Abreu R., Leal A., Figueiredo P. (2018). EEG-informed fMRI: a review of data analysis methods. Front. Hum. Neurosci. 12:29. 10.3389/fnhum.2018.00029 - DOI - PMC - PubMed
    1. Acharjee P. P., Phlypo R., Wu L., Calhoun V. D., Adalı T. (2015). Independent vector analysis for gradient artifact removal in concurrent EEG-fMRI data. IEEE Trans. Biomed. Eng. 62 1750–1758. 10.1109/TBME.2015.2403298 - DOI - PubMed
    1. Aghakhani Y., Bagshaw A. P., Bénar C. G., Hawco C., Andermann F., Dubeau F., et al. (2004). fMRI activation during spike and wave discharges in idiopathic generalized epilepsy. Brain 127 1127–1144. 10.1093/brain/awh136 - DOI - PubMed
    1. Ahmad R. F., Malik A. S., Kamel N., Reza F., Abdullah J. M. (2016). Simultaneous EEG-fMRI for working memory of the human brain. Australas. Phys. Eng. Sci. Med. 39 363–378. 10.1007/S13246-016-0438-X - DOI - PubMed
    1. Ahmad R. F., Malik A. S., Kamel N., Reza F., Karim A. H. A. (2015). “Optimization and development of concurrent EEG-fMRI data acquisition setup for understanding neural mechanisms of brain,” in Proceedings of the 2015 IEEE International Instrumentation and Measurement Technology Conference (I2MTC), (Pisa: IEEE; ), 476–481. 10.1109/I2MTC.2015.7151314 - DOI

LinkOut - more resources