. 2022 Jul 28:15:940005.
doi: 10.3389/fnmol.2022.940005. eCollection 2022.

Regulation of NMDA Receptor Signaling at Single Synapses by Human Anti-NMDA Receptor Antibodies

Affiliations

Regulation of NMDA Receptor Signaling at Single Synapses by Human Anti-NMDA Receptor Antibodies

Charles A Dean et al. Front Mol Neurosci. .

Abstract

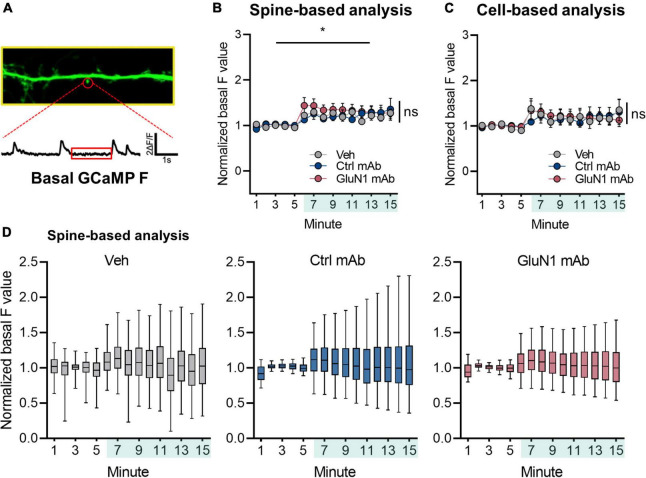
The NMDA receptor (NMDAR) subunit GluN1 is critical for receptor function and plays a pivotal role in synaptic plasticity. Mounting evidence has shown that pathogenic autoantibody targeting of the GluN1 subunit of NMDARs, as in anti-NMDAR encephalitis, leads to altered NMDAR trafficking and synaptic localization. However, the underlying signaling pathways affected by antibodies targeting the NMDAR remain to be fully delineated. It remains unclear whether patient antibodies influence synaptic transmission via direct effects on NMDAR channel function. Here, we show using short-term incubation that GluN1 antibodies derived from patients with anti-NMDAR encephalitis label synapses in mature hippocampal primary neuron culture. Miniature spontaneous calcium transients (mSCaTs) mediated via NMDARs at synaptic spines are not altered in pathogenic GluN1 antibody exposed conditions. Unexpectedly, spine-based and cell-based analyses yielded distinct results. In addition, we show that calcium does not accumulate in neuronal spines following brief exposure to pathogenic GluN1 antibodies. Together, these findings show that pathogenic antibodies targeting NMDARs, under these specific conditions, do not alter synaptic calcium influx following neurotransmitter release. This represents a novel investigation of the molecular effects of anti-NMDAR antibodies associated with autoimmune encephalitis.

Keywords: NMDA receptor; autoimmune encephalitis; calcium signaling; neurotransmission; synaptic.


Conflict of interest statement

The authors declare that the research was conducted in the absence of any commercial or financial relationships that could be construed as a potential conflict of interest.

Figures

FIGURE 1
FIGURE 1
Experimental design to assess role of human GluN1 monoclonal antibodies on synaptic function. Teal shaded bar represents mAb incubation period. Red indicates imaging sessions. DIV, days in vitro; ES, extracellular solution; ICC, immunocytochemistry; mAb, human monoclonal antibodies.
FIGURE 2
FIGURE 2
Human GluN1 monoclonal antibodies rapidly localize to spines in live hippocampal primary neuron culture. (A) Representative cultured hippocampal neuron transduced with GCaMP6f (green) and stained for human mAb (magenta) and synaptic marker Shank (cyan) following control mAb exposure. Right top, zoom in of boxed dendrite in left showing GCaMP6f and Ctrl mAb (magenta). Right middle, GCaMP6f and Shank (cyan). Right bottom, zoom in of GCaMP6f, human mAb, and Shank. Note lack of human control mAb labeling. (B) Representative hippocampal neuron, as in panel (A), exposed to GluN1 mAb. Right bottom, note co-labeling of Shank with human GluN1 mAb (white). (C) Quantification of human mAb staining intensity at spines. A Kruskal-Wallis test with post-hoc Dunn’s revealed a statistically significant difference in mAb labeling between groups [H(3) = 240, p < 0.0001]. Control mAb labeling at spines was not significantly above background levels of vehicle (ns, p = 0.1) and mAb spine labeling was significantly different between GluN1 mAb and vehicle (p < 0.0001) and between GluN1 mAb and control mAb (p < 0.0001). Ctrl, control; mAb, human monoclonal antibody; ns, not significant; Veh, vehicle; ****p < 0.0001; ns, p > 0.05.
FIGURE 3
FIGURE 3
Basal Ca2+ at synaptic sites is not altered by human GluN1 antibodies. (A) Zoom in of dendrite of hippocampal cell transduced with GCaMP6f (green). Spine identified by red circle. Below, ΔF/F trace of spine region identified in panel (A) plotted against time. Red box indicates region analyzed as basal GCaMP Ca2+ measurement. (B) Normalized basal F trace of spine over recording session. Vehicle or mAb added after 5 min baseline; teal shaded bar in x-axis represents incubation period. A one-way Welch’s ANOVA was performed to compare the effect of mAb on normalized basal F values in final 5 min between groups. There was an effect of vehicle treatment (1.23 ± 0.076, n = 1,171 spines, p < 0.05, Welch’s t-test comparing baseline to final 5 min). There was no statistically significant difference between groups at final 5 min (control mAb 1.26 ± 0.16, n = 1,151 spines; GluN1 mAb 1.29 ± 0.12, n = 1,705 spines; one-way Welch’s ANOVA [F(2, 3,182) = 0.07, p = 0.9]. (C) Normalized basal F trace of spines analyzed on per cell basis. No statistically significant difference was observed on F values between treatments at final 5 min (control mAb 1.21 ± 0.46, n = 6 cells; GluN1 mAb 1.16 ± 0.33, n = 6 cells; Veh 1.25 ± 0.51, n = 7 cells; one-way Welch’s ANOVA [F(2, 10) = 0.06, p = 0.9]. (D) Box plots of normalized basal F values in individual treatments over time. Ctrl, control; mAb, human monoclonal antibody; ns, not significant; Veh, vehicle; *p < 0.05; ns, p > 0.05.
FIGURE 4
FIGURE 4
Human GluN1 mAbs have limited effect on NMDAR-dependent miniature spontaneous Ca2+ transients (mSCaTs). (A) Zoom in of dendrite of hippocampal cell transduced with GCaMP6f (green). Spine identified by red circle. Below, ΔF/F trace of spine region identified in panel (A) plotted against time. Red box indicates regions analyzed as mSCaTs. (B) Frequency histogram of mSCaT amplitude (ΔF/F) for individual synapses across 747 spines from 7 cells in vehicle condition. (C) Frequency histogram of mSCaT frequency (Hz) for individual synapses across 747 spines from 7 cells in vehicle condition. (D) Dot plots of normalized mSCaT amplitude in individual treatments over time. Vehicle or mAb added after 5 min baseline. (E) Normalized mSCaT amplitude over recording on per spine basis. A two-way ANOVA was performed to analyze the effect of mAb and time on mSCaT amplitude. Compared to the control mAb, GluN1 mAb from a patient with anti-NMDAR encephalitis showed a small decrease in Ca2+ influx through NMDARs activated by spontaneous glutamate release (spontaneous release) after 10 min exposure. (F) Normalized mSCaT amplitude over recording session (mean ± SEM for each group; n = 6–7 cells). A two-way ANOVA was performed to analyze the effect of mAb and time on mSCaT amplitude on per cell basis. There was no statistically significant interaction between the effects of mAb and time [F(4, 32) = 0.07, p = 1.0]. Simple main effects analysis showed that mAb did not have a statistically significant effect on mSCaT amplitude (p = 0.9). Simple main effects analysis showed that time did have a statistically significant effect on mSCaT frequency (p = 0.001). Both timepoints were significantly increased from baseline using Dunnett’s multiple comparisons test (5–10 min, p = 0.0006; 10–15 min, p = 0.009). (G) Dot plots of normalized mSCaT frequency in individual treatments over time. Vehicle or mAb added after 5 min baseline. (H) Normalized mSCaT frequency over recording session. A one-way ANOVA was performed to analyze the effect of mAb on mSCaT frequency at 5–10 min [F(2, 2,575) = 4.8, p = 0.009] and 10–15 min [F(2, 2,575) = 12, p ≤ 0.0001] timepoints. Unexpectedly, there was a significant reduction in the mSCaT frequency observed with GluN1 mAb compared to control mAb at 5–10 min (p = 0.007, Fisher’s LSD) and 10–15 min (p = 0.01, Fisher’s LSD) timepoints. This effect was significant also observed comparing GluN1 mAb to vehicle at 1–5 min (p = 0.01, Fisher’s LSD) and 5–10 min (p < 0.0001) exposure time. The control mAb had no effect compared to vehicle at 5–10 min (p > 0.05, Fisher’s LSD), but reduced mSCaT frequency at 10–15 min compared to vehicle (p = 0.03, Fisher’s LSD). (I) Normalized mSCaT frequency over recording session (mean ± SEM for each group; n = 6–7 cells). A two-way ANOVA was performed to analyze the effect of mAb and time on mSCaT frequency. There was no statistically significant interaction between the effects of mAb and time [F(4, 32) = 0.38, p = 0.8]. Simple main effects analysis showed that mAb did not have a statistically significant effect on mSCaT frequency (p = 0.8). Simple main effects analysis showed that time did have a statistically significant effect on mSCaT frequency (p = 0.0012). Post-hoc Dunnett’s multiple comparisons test revealed mSCaT frequency at 10–15 min was significantly different from baseline (p = 0.0012). Ctrl, control; mAb, human monoclonal antibody; ns, not significant; Veh, vehicle; *p < 0.05, **p < 0.01, ***p < 0.0001; ns, p > 0.05.

Similar articles

Cited by

References

    1. Adekar S. P., Jones R. M., Elias M. D., Al-Saleem F. H., Root M. J., Simpson L. L., et al. (2008). ‘Hybridoma populations enriched for affinity-matured human IgGs yield high-affinity antibodies specific for botulinum neurotoxins’. J. Immunol. Methods 333 156–166. 10.1016/j.jim.2008.01.015 - DOI - PubMed
    1. Andreae L. C., Burrone J. (2014). ‘The role of neuronal activity and transmitter release on synapse formation’. Curr. Opin. Neurobiol. 27 47–52. - PMC - PubMed
    1. Andreae L. C., Burrone J. (2015). ‘Spontaneous neurotransmitter release shapes dendritic arbors via long-range activation of NMDA receptors’. Cell Rep. 10 873–882. 10.1016/j.celrep.2015.01.032 - DOI - PMC - PubMed
    1. Andreae L. C., Burrone J. (2018). ‘The role of spontaneous neurotransmission in synapse and circuit development’. J. Neurosci. Res. 96 354–359. - PMC - PubMed
    1. Aow J., Dore K., Malinow R. (2015). ‘Conformational signaling required for synaptic plasticity by the NMDA receptor complex’. Proc. Natl. Acad. Sci. U.S.A. 112 14711–14716. - PMC - PubMed

LinkOut - more resources