

Altered expression of Tim family molecules and an imbalanced ratio of Tim-3 to Tim-1 expression in patients with type 1 diabetes
- PMID: 35966054
- PMCID: PMC9366857
- DOI: 10.3389/fendo.2022.937109
Altered expression of Tim family molecules and an imbalanced ratio of Tim-3 to Tim-1 expression in patients with type 1 diabetes
Abstract
Background: T-cell immunoglobulin and mucin domain (Tim) proteins are immunomodulatory molecules that play key roles in the regulation of T-cell activation. Published studies have reported that Tim molecules are involved in the pathogenesis of certain autoimmune diseases. Type 1 diabetes (T1D) is an autoimmune disease in which T cells mediate the destruction of islet β cells. However, the expression of Tim molecules in T1D remains unclear. In this study, we measured the expression of Tim family molecules as well as T-cell subset-specific transcription factors in T1D patients, and we explored the possible involvement of Tim molecules in the pathogenesis of T1D.
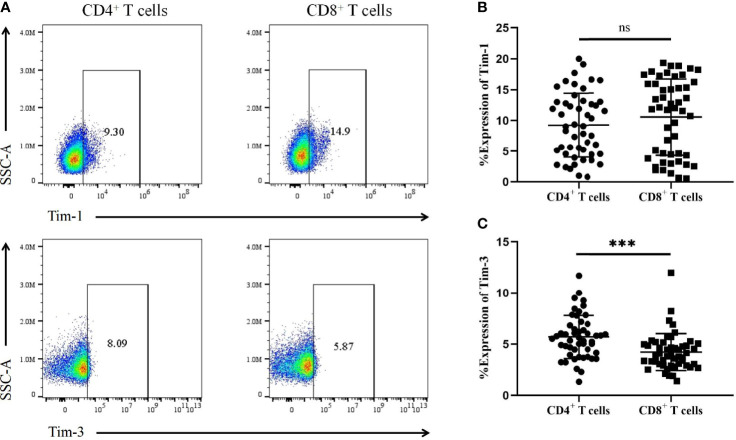
Methods: Ninety T1D patients, Thirty-six type 2 diabetes (T2D) patients and forty healthy controls (HCs) were recruited for this study. Peripheral blood mononuclear cells (PBMCs) were isolated, RNA was extracted from the PBMCs and reverse transcribed into cDNA, and gene expression patterns were analysed by RT-qPCR. The expression of Tim molecules in different T-cell subsets was analysed by flow cytometry.
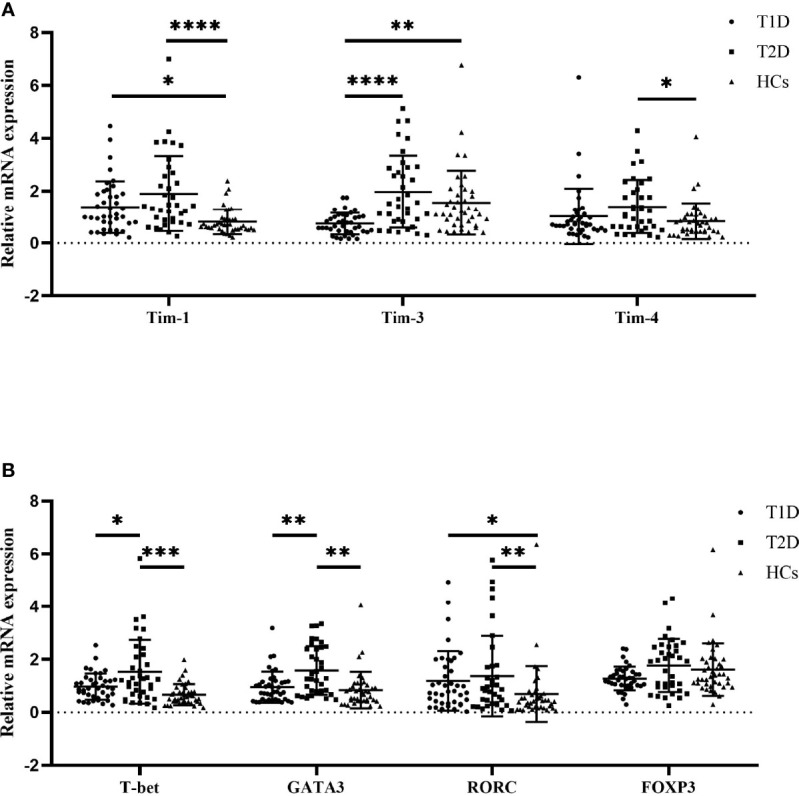
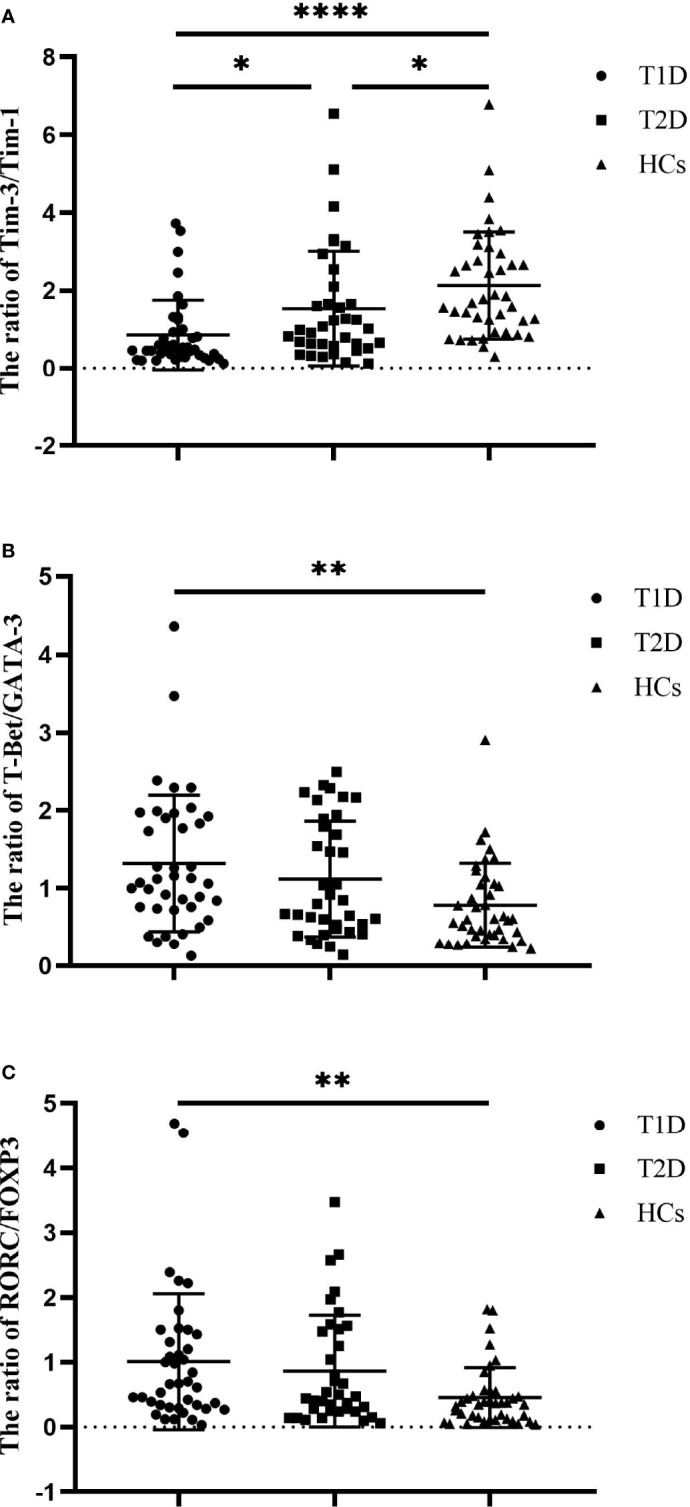
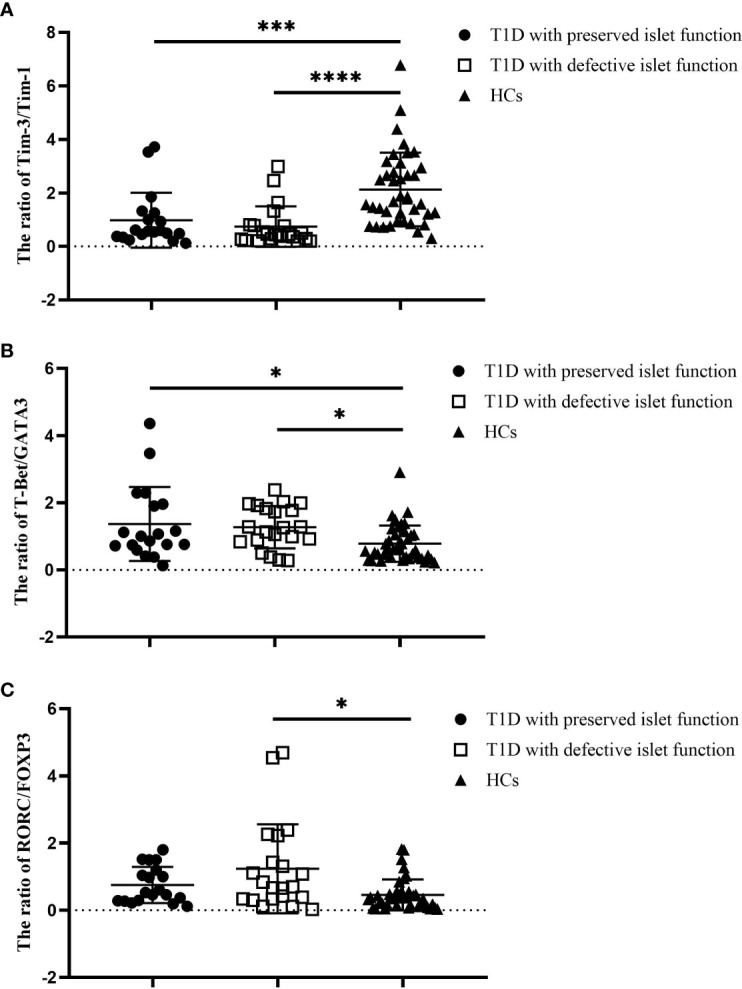
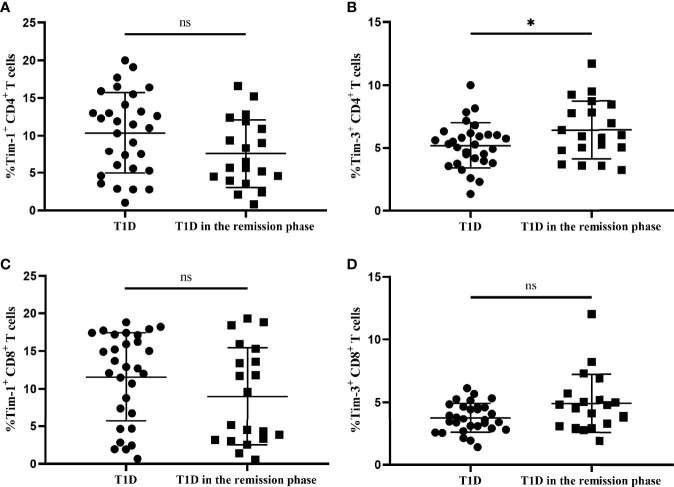
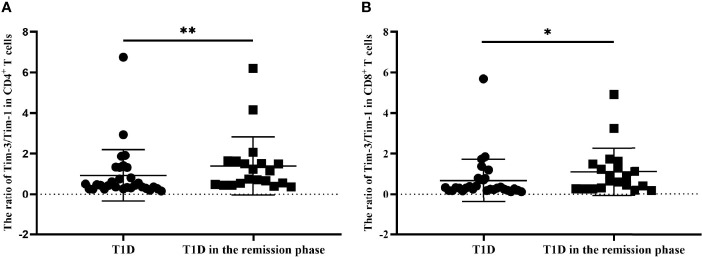
Results: Compared with that in HCs, the mRNA expression of Tim-1 and RORC was increased in T1D patients (P=0.0355 and P=0.0423, respectively), while the expression of Tim-3 was decreased (P=0.0013). In addition, compared with HCs, the ratio of Tim-3 to Tim-1 expression in diabetic patients was decreased (P<0.0001 for T1D and P=0.0387 for T2D). The ratios of T-Bet to GATA3 expression and RORC to FOXP3 expression were higher in T1D patients than in HCs (P=0.0042 and P=0.0066, respectively). Furthermore, the T1D patients with defective islet function had more significant imbalances in the Tim-3/Tim-1 and RORC/FOXP3 ratios (P<0.0001, and P=0.001, respectively). Moreover, Both Tim-3 expression in CD4+ T cells and the Tim-3 to Tim-1 ratio were elevated in T1D in the remission phase compared to T1D.
Conclusion: Our study revealed altered expression of Tim molecules in T1D patients. The imbalanced ratios of Tim-3/Tim-1 expression were more pronounced in T1D patients with defective islet function. However, alterations in Tim molecule expression are mitigated in T1D in the remission phase. All these findings suggest that Tim family molecules may be involved in the pathogenesis of T1D.
Keywords: T cell subset-specific transcription factors; Tim-1; Tim-3; Tim-4; type 1 diabetes.
Copyright © 2022 Liu, Chen, Xiao, Chen and Zhou.
Conflict of interest statement
The authors declare that the research was conducted in the absence of any commercial or financial relationships that could be construed as a potential conflict of interest.
Figures
Similar articles
-
Altered Tim-1 and IL-10 Expression in Regulatory B Cell Subsets in Type 1 Diabetes.Front Immunol. 2021 Dec 21;12:773896. doi: 10.3389/fimmu.2021.773896. eCollection 2021. Front Immunol. 2021. PMID: 35754999 Free PMC article.
-
The expression of Tim-1 and Tim-4 molecules in regulatory T cells in type 1 diabetes.Endocrine. 2020 Apr;68(1):64-70. doi: 10.1007/s12020-019-02173-8. Epub 2020 Jan 8. Endocrine. 2020. PMID: 31916216
-
Imbalanced expression of human Tim-1 and Tim-3 in peripheral blood mononuclear cells from immune thrombocytopenia patients.Int Immunopharmacol. 2014 Mar;19(1):1-4. doi: 10.1016/j.intimp.2013.12.025. Epub 2014 Jan 7. Int Immunopharmacol. 2014. PMID: 24412470
-
T-cell immunoglobulin and mucin-domain containing-3 (TIM-3): Solving a key puzzle in autoimmune diseases.Int Immunopharmacol. 2023 Aug;121:110418. doi: 10.1016/j.intimp.2023.110418. Epub 2023 Jun 6. Int Immunopharmacol. 2023. PMID: 37290326 Review.
-
Role of Tim-3 in COVID-19: a potential biomarker and therapeutic target.Arch Virol. 2023 Jul 31;168(8):213. doi: 10.1007/s00705-023-05842-2. Arch Virol. 2023. PMID: 37522944 Review.
Cited by
-
Immune checkpoints and pancreatic beta cell dysfunction in HIV.AIDS. 2024 Sep 1;38(11):1725-1727. doi: 10.1097/QAD.0000000000003932. Epub 2024 Aug 1. AIDS. 2024. PMID: 39088830
-
Mechanisms and therapeutic strategies of immune checkpoint molecules and regulators in type 1 diabetes.Front Endocrinol (Lausanne). 2023 Jan 10;13:1090842. doi: 10.3389/fendo.2022.1090842. eCollection 2022. Front Endocrinol (Lausanne). 2023. PMID: 36704045 Free PMC article. Review.
-
The role of Tim-3+T cell subsets in the peripheral blood of patients with COVID-19 and diabetes.iScience. 2025 Apr 3;28(5):112339. doi: 10.1016/j.isci.2025.112339. eCollection 2025 May 16. iScience. 2025. PMID: 40330891 Free PMC article.
-
The Putative Role of TIM-3 Variants in Polyendocrine Autoimmunity: Insights from a WES Investigation.Int J Mol Sci. 2024 Oct 12;25(20):10994. doi: 10.3390/ijms252010994. Int J Mol Sci. 2024. PMID: 39456777 Free PMC article.
References
Publication types
MeSH terms
Substances
LinkOut - more resources
Full Text Sources
Medical
Research Materials