

Integrated analysis of proteomics and metabolomics in girls with central precocious puberty
- PMID: 35966072
- PMCID: PMC9365929
- DOI: 10.3389/fendo.2022.951552
Integrated analysis of proteomics and metabolomics in girls with central precocious puberty
Abstract
Background: Central precocious puberty (CPP) is a multifactorial and complex condition. Traditional studies focusing on a single indicator cannot always elucidate this panoramic condition but these may be revealed by using omics techniques.
Objective: Proteomics and metabolomics analysis of girls with CPP were compared to normal controls and the potential biomarkers and pathways involved were explored.
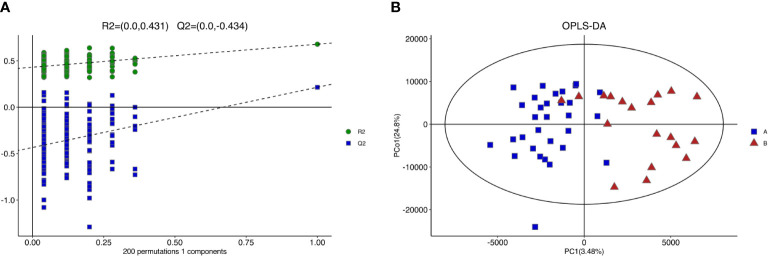
Methods: Serum proteins and metabolites from normal girls and those with CPP were compared by LC-MS/MS. Multivariate and univariate statistical analysis were used to identify the differentially expressed proteins (DEPs) and differentially expressed metabolites (DEMs). Functional annotation and pathway enrichment analysis were performed by using GO and KEGG databases, and candidate markers were screened. Finally, bioinformatic analysis was used to integrate the results of proteomics and metabolomics to find the key differential proteins, metabolites and potential biomarkers of CPP.
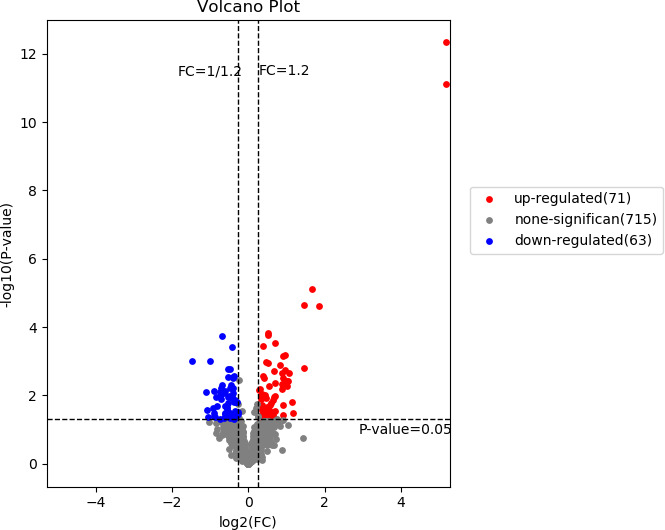
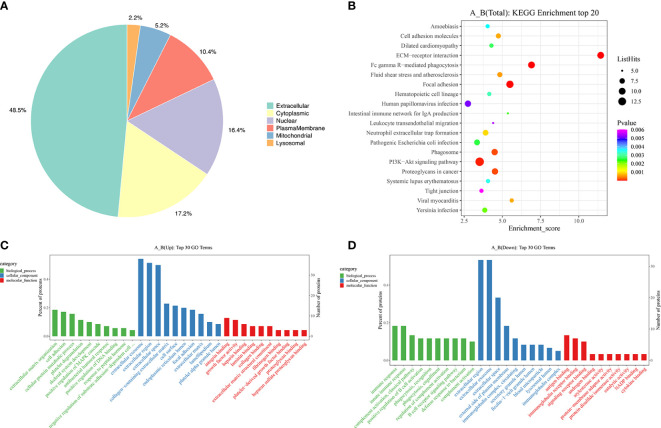
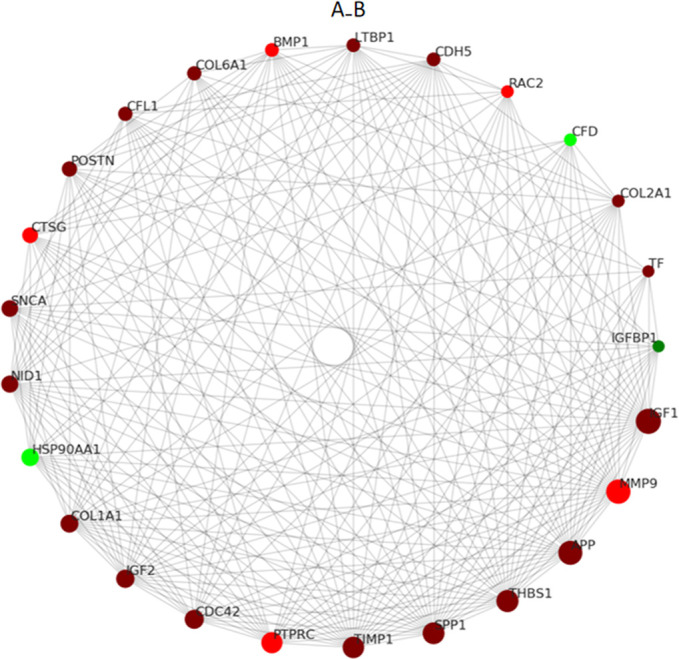
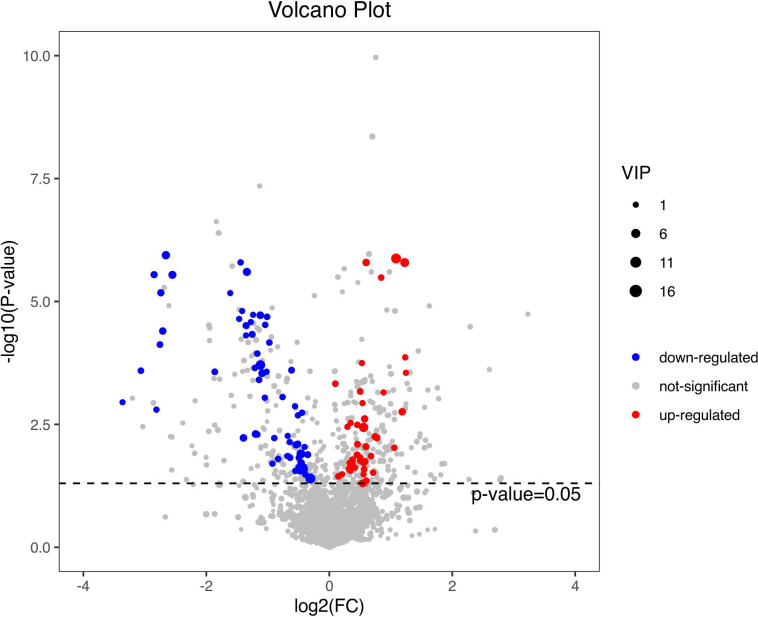
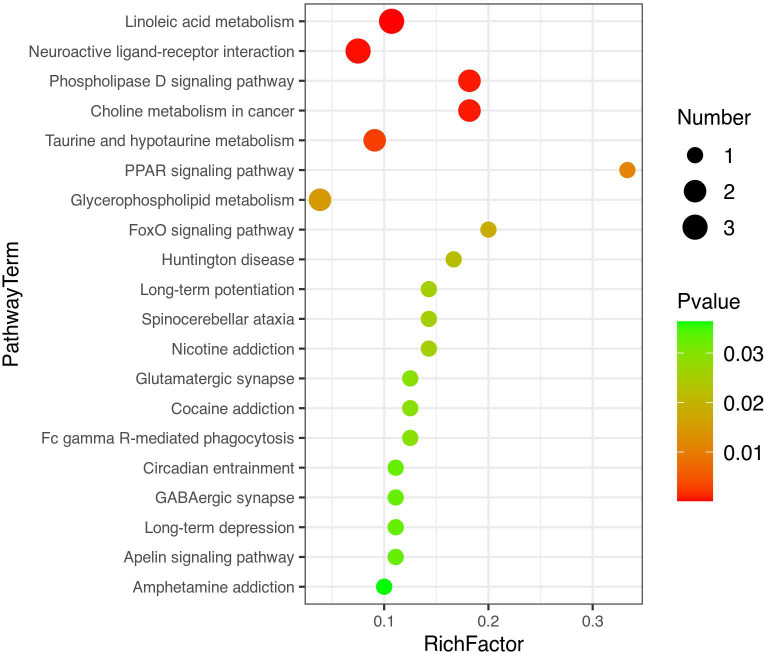
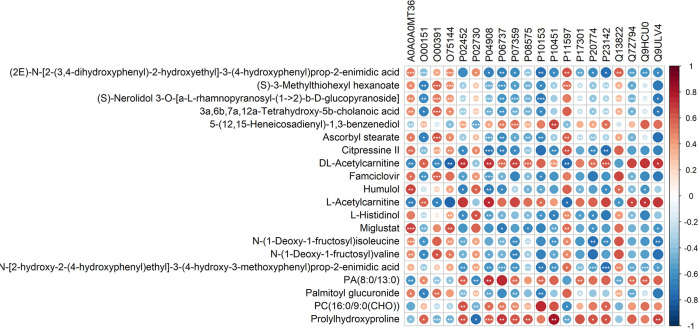
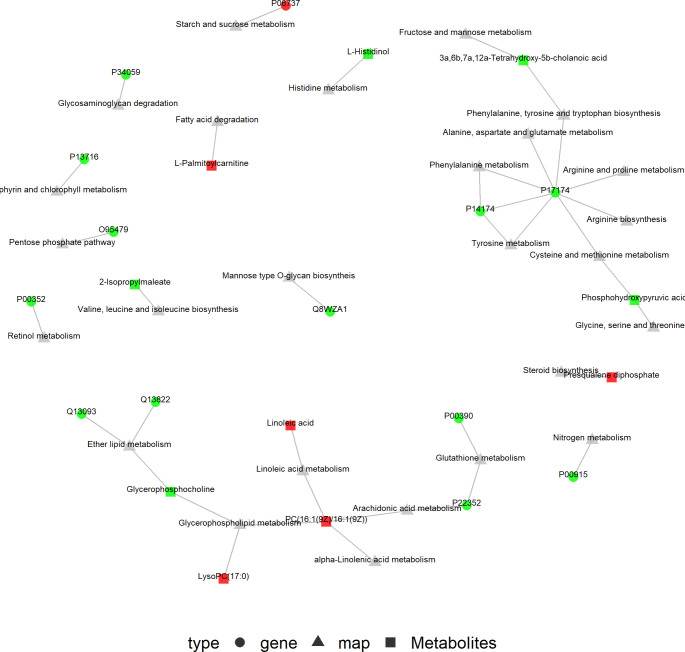
Results: 134 DEPs were identified in girls with CPP with 71 up- and 63 down-regulated, respectively. Up-regulated proteins were enriched mainly in the extracellular matrix, cell adhesion and cellular protein metabolic processes, platelet degranulation and skeletal system development. The down-regulated proteins were mainly enriched in the immune response. Candidate proteins including MMP9, TIMP1, SPP1, CDC42, POSTN, COL1A1, COL6A1, COL2A1 and BMP1, were found that may be related to pubertal development. 103 DEMs were identified, including 42 up-regulated and 61 down-regulated metabolites which were mainly enriched in lipid and taurine metabolic pathways. KGML network analysis showed that phosphocholine (16:1(9Z)/16:1(9Z)) was involved in arachidonic acid, glycerophospholipid, linoleic acid and α-linolenic acid metabolism and it may be used as a biomarker of CPP.
Conclusions: Our study is the first to integrate proteomics and metabolomics to analyze the serum of girls with CPP and we found some key differential proteins and metabolites as well as a potential biomarker for this condition. Lipid metabolism pathways are involved and these may provide a key direction to further explore the molecular mechanisms and pathogenesis of CPP.
Keywords: biomarker; central precocious puberty (CPP); lipid pathway; metabolomics; proteomics.
Copyright © 2022 Li, Lan and Chen.
Conflict of interest statement
The authors declare that the research was conducted in the absence of any commercial or financial relationships that could be construed as a potential conflict of interest.
Figures
Similar articles
-
Perfluorinated compounds linked to central precocious puberty in girls during COVID-19: an untargeted metabolomics study.Front Endocrinol (Lausanne). 2024 Dec 24;15:1491411. doi: 10.3389/fendo.2024.1491411. eCollection 2024. Front Endocrinol (Lausanne). 2024. PMID: 39777221 Free PMC article.
-
Gut microbiome combined with metabolomics reveals biomarkers and pathways in central precocious puberty.J Transl Med. 2023 May 11;21(1):316. doi: 10.1186/s12967-023-04169-5. J Transl Med. 2023. PMID: 37170084 Free PMC article.
-
Potential metabolic mechanism of girls' central precocious puberty: a network analysis on urine metabonomics data.BMC Syst Biol. 2012;6 Suppl 3(Suppl 3):S19. doi: 10.1186/1752-0509-6-S3-S19. Epub 2012 Dec 17. BMC Syst Biol. 2012. PMID: 23282096 Free PMC article.
-
Kisspeptin Levels in Girls with Precocious Puberty: A Systematic Review and Meta-Analysis.Horm Res Paediatr. 2020;93(11-12):589-598. doi: 10.1159/000515660. Epub 2021 Apr 22. Horm Res Paediatr. 2020. PMID: 33887744
-
Central precocious puberty, functional and tumor-related.Best Pract Res Clin Endocrinol Metab. 2019 Jun;33(3):101262. doi: 10.1016/j.beem.2019.01.003. Epub 2019 Jan 22. Best Pract Res Clin Endocrinol Metab. 2019. PMID: 30733078 Review.
Cited by
-
Gut microbiota-metabolite interactions meditate the effect of dietary patterns on precocious puberty.iScience. 2024 May 3;27(6):109887. doi: 10.1016/j.isci.2024.109887. eCollection 2024 Jun 21. iScience. 2024. PMID: 38784002 Free PMC article.
-
Multi-omic analysis of precocious puberty girls: pathway changes and metabolite validation.Front Endocrinol (Lausanne). 2024 Feb 29;15:1285666. doi: 10.3389/fendo.2024.1285666. eCollection 2024. Front Endocrinol (Lausanne). 2024. PMID: 38487340 Free PMC article.
-
Association of size for gestational age and dehydroepiandrosterone sulfate with cardiometabolic risk in central precocious puberty girls.Front Endocrinol (Lausanne). 2023 May 24;14:1131438. doi: 10.3389/fendo.2023.1131438. eCollection 2023. Front Endocrinol (Lausanne). 2023. PMID: 37293501 Free PMC article.
-
Integrated analysis of proteomics and metabolomics in infantile epileptic spasms syndrome.Sci Rep. 2025 Feb 6;15(1):4457. doi: 10.1038/s41598-025-88943-z. Sci Rep. 2025. PMID: 39915639 Free PMC article.
-
Comprehensive analysis of untargeted metabolomics and lipidomics in girls with central precocious puberty.Front Pediatr. 2023 May 12;11:1157272. doi: 10.3389/fped.2023.1157272. eCollection 2023. Front Pediatr. 2023. PMID: 37252040 Free PMC article.
References
-
- Subspecialty Group of Endocrinologic, Hereditary and Metabolic Diseases, the Society of Pediatrics, Chinese Medical Association & Editorial Board, Chinese Journal of Pediatrics. Consensus statement for the diagnosis and treatment of central precocious puberty. Zhonghua er ke za zhi = Chin J Pediatr (2015) 53(6):412–82015. doi: 10.3760/cma.j.issn.0578-1310.2015.06.004 - DOI - PubMed
-
- Eckert-Lind C, Busch AS, Petersen JH, Biro FM, Butler G, Bräuner EV, et al. . Worldwide secular trends in age at pubertal onset assessed by breast development among girls: A systematic review and meta-analysis. JAMA Pediatrics (2020) 174(4):e195881. doi: 10.1001/jamapediatrics.2019.5881 - DOI - PMC - PubMed
Publication types
MeSH terms
Substances
Associated data
LinkOut - more resources
Full Text Sources
Research Materials
Miscellaneous