. 2022 Jul 29:13:910907.
doi: 10.3389/fendo.2022.910907. eCollection 2022.

5-Hydroxymethylcytosine profiles in plasma cell-free DNA reflect molecular characteristics of diabetic kidney disease

Affiliations

5-Hydroxymethylcytosine profiles in plasma cell-free DNA reflect molecular characteristics of diabetic kidney disease

Jin-Lin Chu et al. Front Endocrinol (Lausanne). .

Abstract

Background: Diabetic kidney disease (DKD), one of the main complications of diabetes mellitus (DM), has become a frequent cause of end-stage renal disease. A clinically convenient, non-invasive approach for monitoring the development of DKD would benefit the overall life quality of patients with DM and contribute to lower medical burdens through promoting preventive interventions.

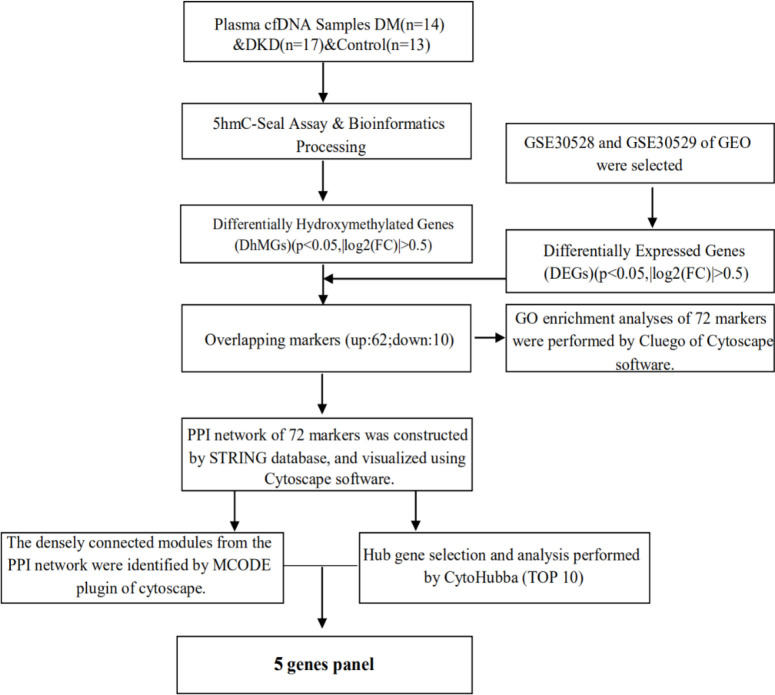
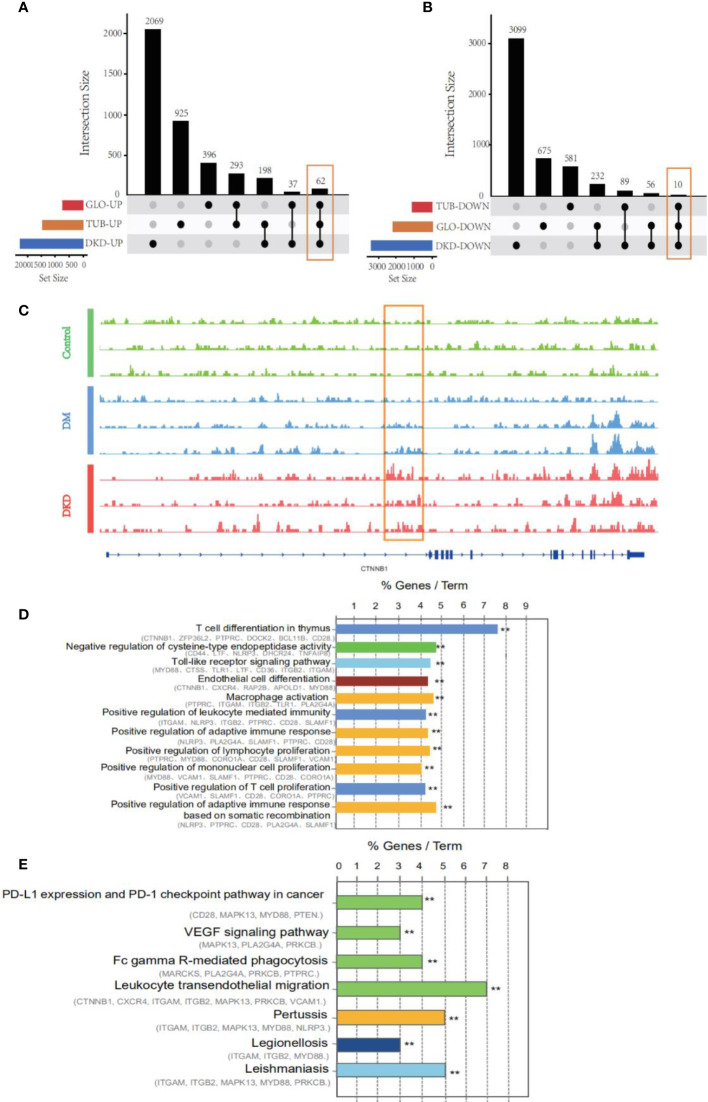
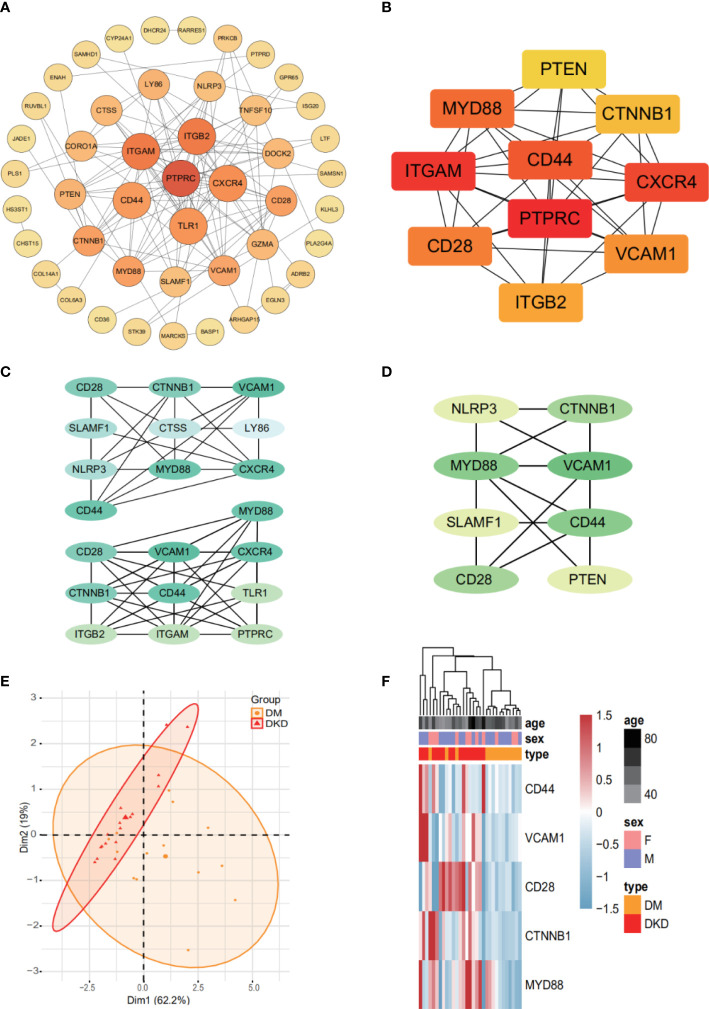
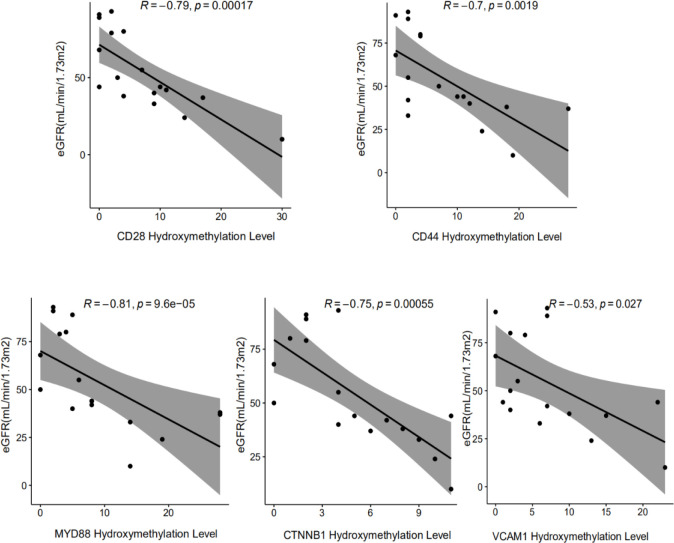
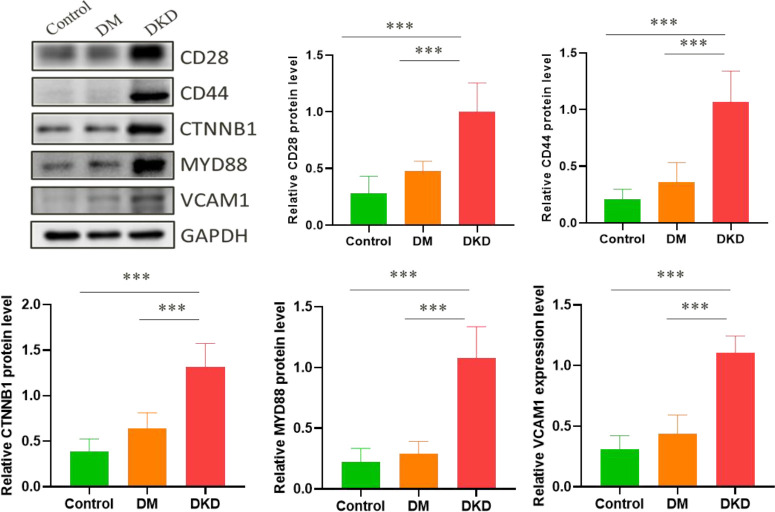
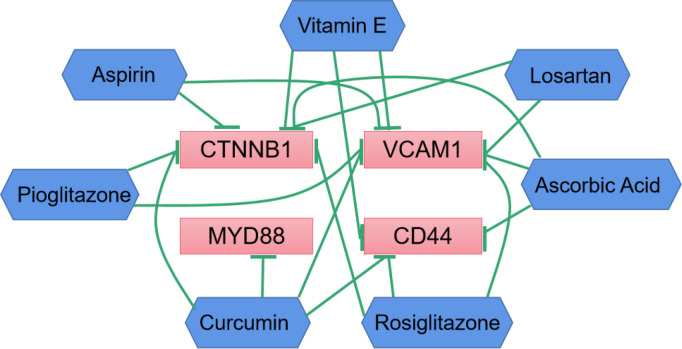
Methods: We utilized 5hmC-Seal to profile genome-wide 5-hydroxymethylcytosines in plasma cell-free DNA (cfDNA). Candidate genes were identified by intersecting the differentially hydroxymethylated genes and differentially expressed genes from the GSE30528 and GSE30529. Then, a protein interaction network was constructed for the candidate genes, and the hub genes were identified by the MCODE and cytoHubba algorithm. The correlation analysis between the hydroxymethylation level of the hub genes and estimated glomerular filtration rate (eGFR) was carried out. Finally, we demonstrated differences in expression levels of the protein was verified by constructing a mouse model of DKD. In addition, we constructed a network of interactions between drugs and hub genes using the Comparative Toxicogenomics Database.

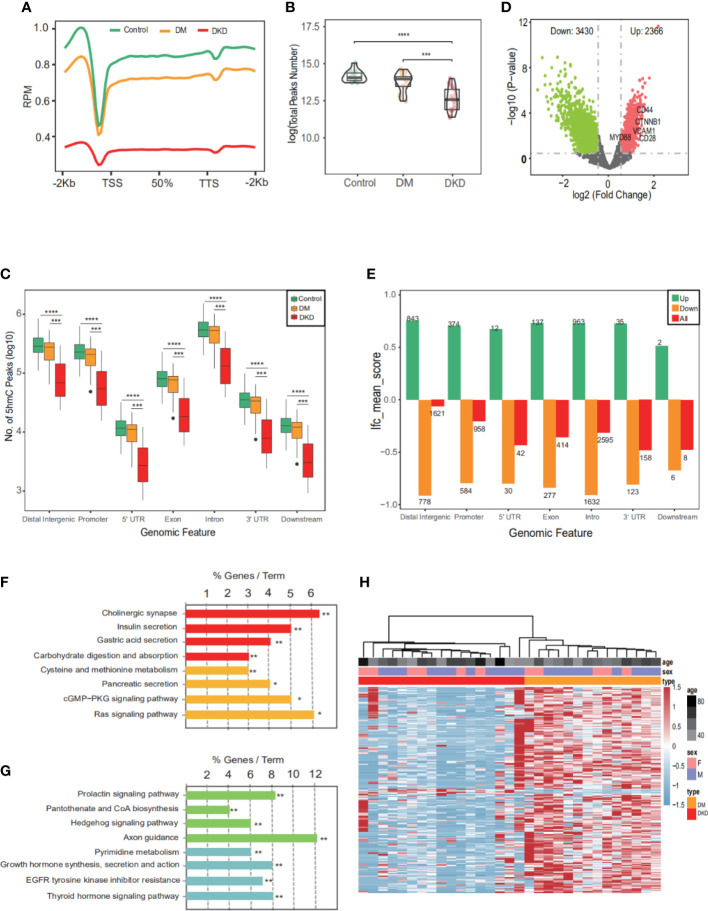
Results: This study found that there were significant differences in the overall distribution of 5hmC in plasma of patients with DKD, and an alteration of hydroxymethylation levels in genomic regions involved in inflammatory pathways which participate in the immune response. The final 5 hub genes, including (CTNNB1, MYD88, CD28, VCAM1, CD44) were confirmed. Further analysis indicated that this 5-gene signature showed a good capacity to distinguish between DKD and DM, and was found that protein levels were increased in renal tissue of DKD mice. Correlation analysis indicated that the hydroxymethylation level of 5 hub genes were nagatively correlated with eGFR. Toxicogenomics analysis showed that a variety of drugs for the treatment of DKD can reduce the expression levels of 4 hub genes (CD44, MYD88, VCAM1, CTNNB1).

Conclusions: The 5hmC-Seal assay was successfully applied to the plasma cfDNA samples from a cohort of DM patients with or without DKD. Altered 5hmC signatures indicate that 5hmC-Seal has the potential to be a non-invasive epigenetic tool for monitoring the development of DKD and it provides new insight for the future molecularly targeted anti-inflammation therapeutic strategies of DKD.

Keywords: 5-hydroxymethylcytosine 5-; Epigenetics; biomarker; cell-free DNDNA; diabetic kidney disease.


Conflict of interest statement

The authors declare that the research was conducted in the absence of any commercial or financial relationships that could be construed as a potential conflict of interest.

Figures

Figure 1
Figure 1
Overview of study design.
Figure 2
Figure 2
Characteristics of 5hmC distribution in plasma cfDNA of DKD patients. (A) The profiled 5hmC-Seal data in all samples cfDNA are enriched in gene bodies and depleted in the flanking regions. (B) Number of 5hmC peaks detected per million reads in Control, DM, and DKD cohorts. Each dot depicts an individual sample. (C) Genome-wide 5hmC distribution in different genomic features grouped by 3 groups (Control vs. DM vs. DKD). (D) Volcano plot. Significantly altered DhMGs (|log2FC| > 0.5, p-value <0.05) are highlighted in red (up) or green (down) using the DKD vs DM cfDNA samples. Grey dots represent the genes that are not differentially expressed. (E) Mean log2Foldchange value of 5796 DhMGs across different genomic features. (F) Pathways enriched in the upregulated marker genes with modified 5hmC between patients with and without DKD are shown. (G) Pathways enriched in the downregulated marker genes with modified 5hmC between patients. (H) Heatmap of top 200 DhMGs with sample type, age, and sex information labeled. Unsupervised hierarchical clustering was performed across genes and samples. RPM: Reads of exon model per Million mapped reads, *p<0.05, **p<0.01, ***p<0.001, ****p<0.001.
Figure 3
Figure 3
An alteration of hydroxymethylation levels in overlapping markers involved in inflammatory pathways which participate in the immune response. (A) An upset diagram of 62 intersected genes was found in upregulated genes via taking the intersection of DhMGs from 5hmC-Seal and DEGs from GSE30528 and GSE30529. DKD: 5hmC-Seal, TUB: GSE30529, GLO: GSE30528. (B) 10 intersected and downregulated genes among our cohort and GSE30528 and GSE30529. (C) IGV genome browser snapshot of CTNNB1 locus showing the increased 5hmC signal intensity in DKD samples compared to Control and DM. (D) GO enrichment analysis and function exploration of 72 DhMGs using Cytoscape software. (**p < 0.01). (E) KEGG pathways of 72 DhMGs using Cytoscape software. (**p < 0.01).
Figure 4
Figure 4
The final 5 genes panel could well distinguish DKD from DM. (A) Based on database STRING and Cytoscape software, PPI networks of 72 DhMGs were constructed. The darker the color of the node, the greater the degree value. (B) Hub genes (TOP10) selection and analysis performed by the MCC Algorithm. (C) Hub genes (TOP10) selection and analysis performed by the DMNC (top), and MNC (bottom) algorithms. (D) Module with an MCODE score of 4.8. (E) PCA plots showing DM (orange) and DKD (red) cfDNA cohorts using 5 genes panel as features. (F) Heatmaps of 5 genes panel with sample type, age, and sex information labeled in our cohort. Unsupervised hierarchical clustering was performed across genes and samples.
Figure 5
Figure 5
Correlation analysis between the hydroxymethylation level of cfDNA derived 5 DhMGs and the clinical parameters in DKD patients. The significant negative correlation could be found among the hydroxymethylation level of CD28, CD44, CTNNB1, MYD88, VCAM1 with eGFR.
Figure 6
Figure 6
Related protein expression levels in mice kidney tissue. (***p < 0.001).
Figure 7
Figure 7
Drug-gene interactions network with drugs (blue) and 4 hub genes (red) was constructed using the CTD database. The green arrows represent that the drugs will decrease the expression of the hub genes.

Similar articles

Cited by

References

    1. Thomas MC, Brownlee M, Susztak K, Sharma K, Jandeleit-Dahm KA, Zoungas S, et al. . Diabetic kidney disease. Nat Rev Dis Primers (2015) 1:15018. doi: 10.1038/nrdp.2015.18 - DOI - PMC - PubMed
    1. Umanath K, Lewis JB. Update on diabetic nephropathy: Core curriculum 2018. Am J Kidney Dis (2018) 71:884–95. doi: 10.1053/j.ajkd.2017.10.026 - DOI - PubMed
    1. Hanouneh M, Echouffo Tcheugui JB, Jaar BG. Recent advances in diabetic kidney disease. BMC Med (2021) 19:180. doi: 10.1186/s12916-021-02050-0 - DOI - PMC - PubMed
    1. Perkins BA, Ficociello LH, Silva KH, Finkelstein DM, Warram JH, Krolewski AS. Regression of microalbuminuria in type 1 diabetes. N Engl J Med (2003) 348:2285–93. doi: 10.1056/NEJMoa021835 - DOI - PubMed
    1. Thomas MC, Macisaac RJ, Jerums G, Weekes A, Moran J, Shaw JE, et al. . Nonalbuminuric renal impairment in type 2 diabetic patients and in the general population (national evaluation of the frequency of renal impairment cO-existing with NIDDM [NEFRON] 11). Diabetes Care (2009) 32:1497–502. doi: 10.2337/dc08-2186 - DOI - PMC - PubMed

Publication types

Substances