

Kisspeptin treatment improves fetal-placental development and blocks placental oxidative damage caused by maternal hypothyroidism in an experimental rat model
- PMID: 35966095
- PMCID: PMC9365946
- DOI: 10.3389/fendo.2022.908240
Kisspeptin treatment improves fetal-placental development and blocks placental oxidative damage caused by maternal hypothyroidism in an experimental rat model
Abstract
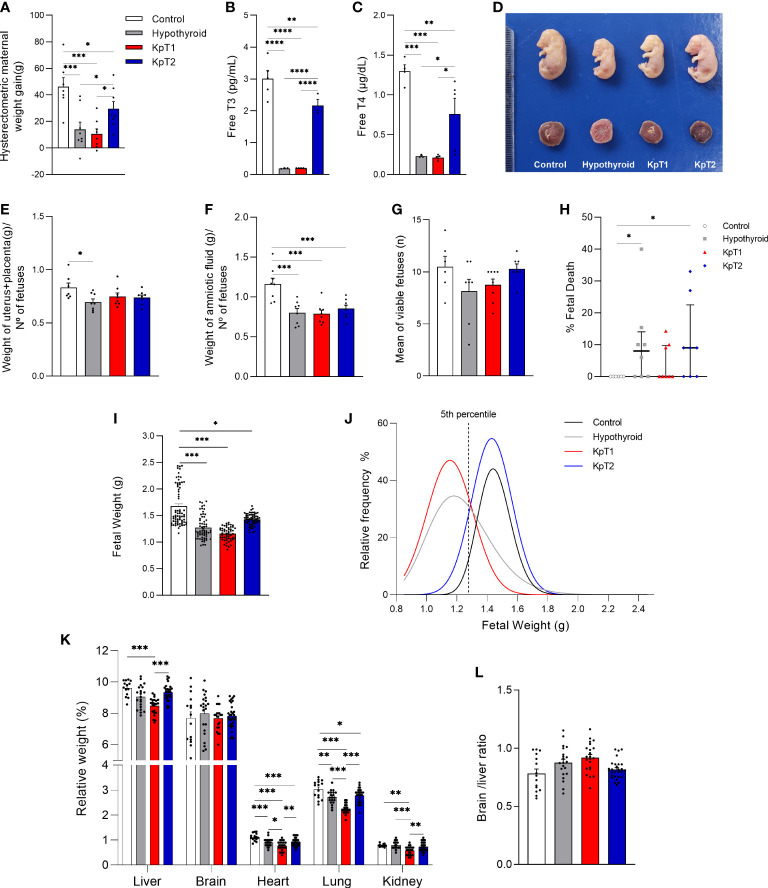
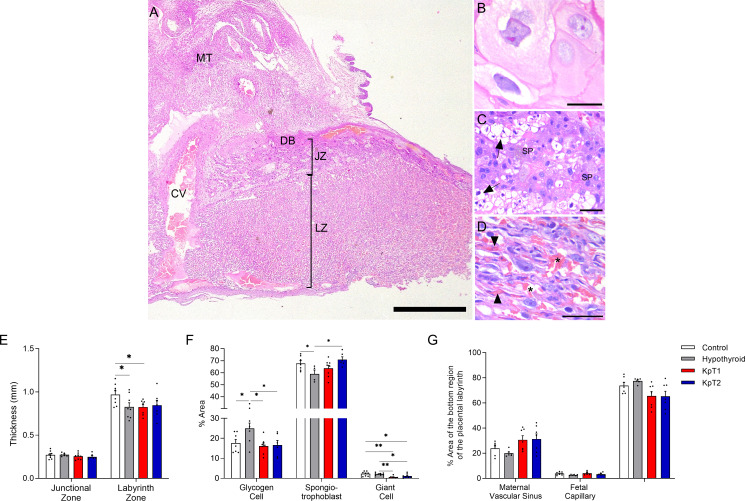
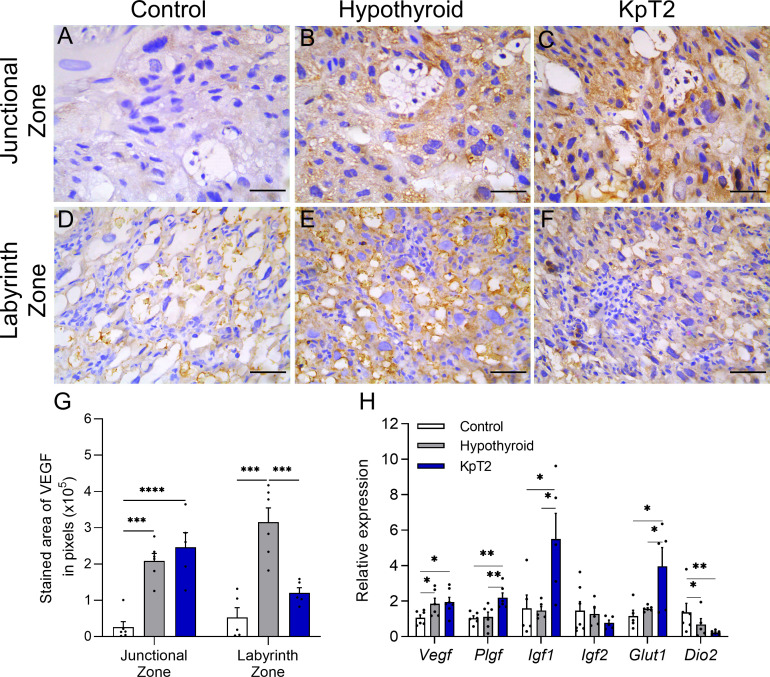
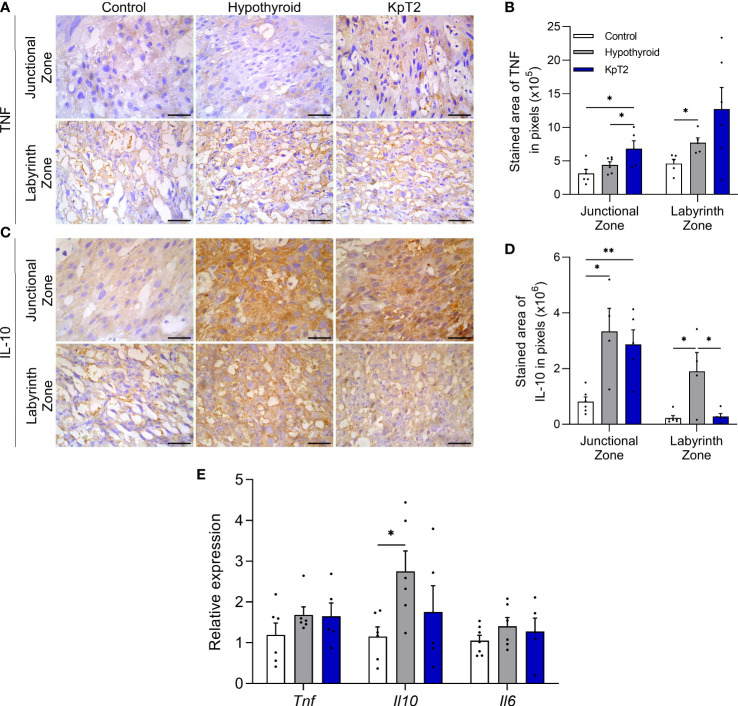
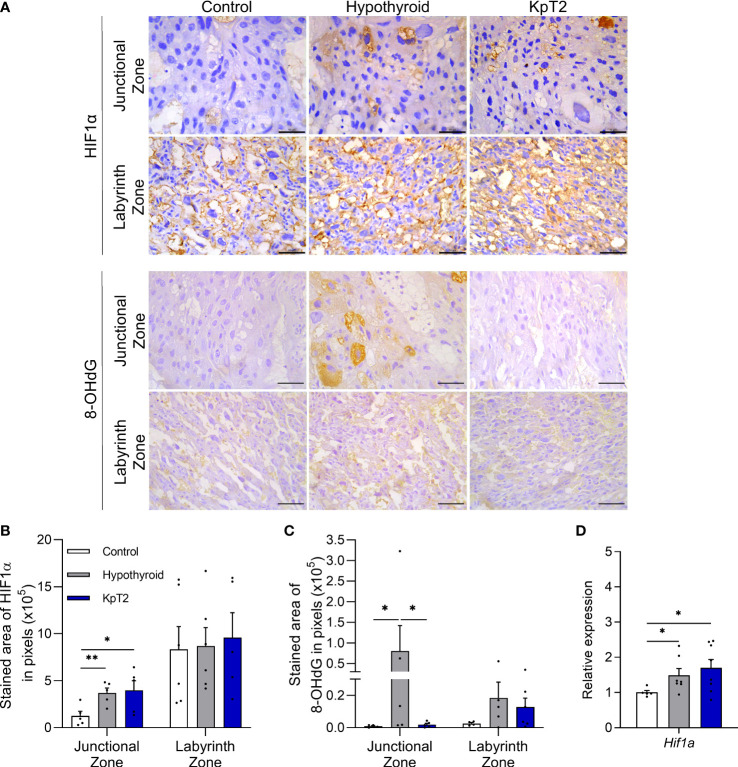
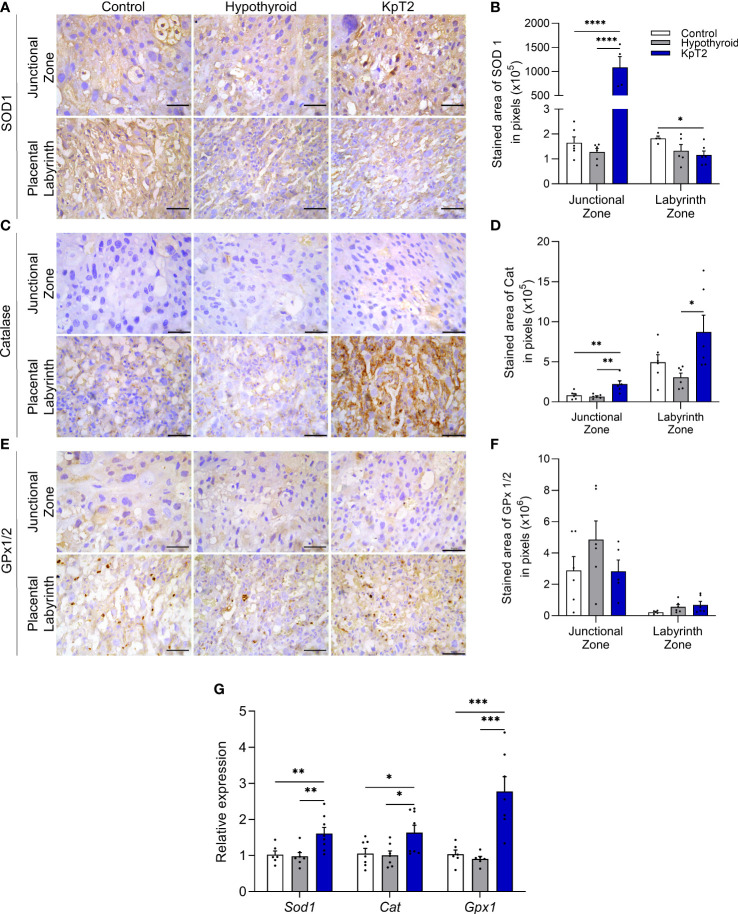
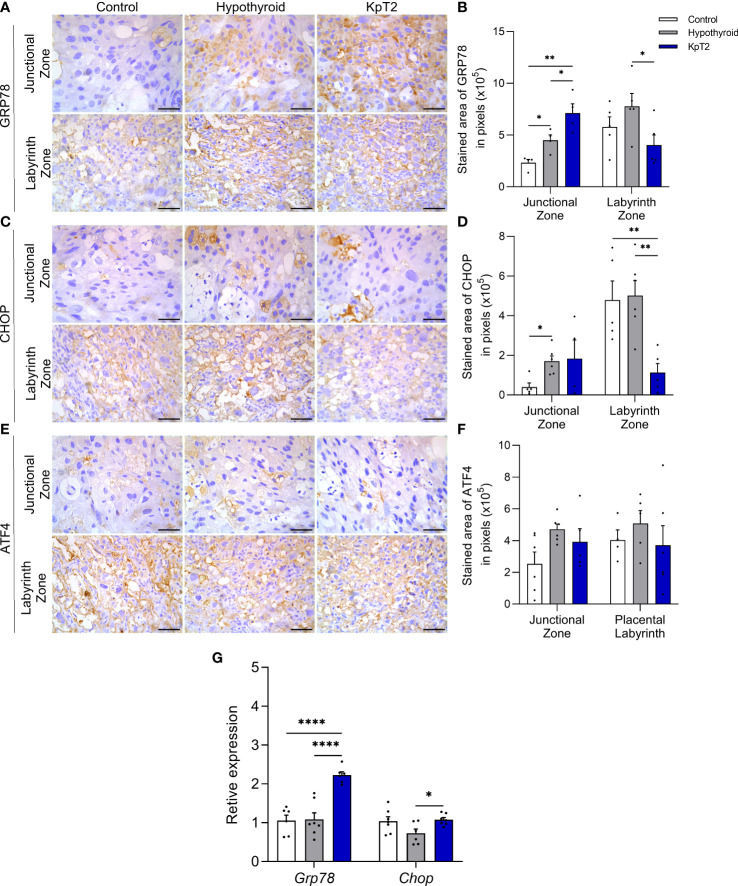
Maternal hypothyroidism is associated with fetal growth restriction, placental dysfunction, and reduced kisspeptin/Kiss1R at the maternal-fetal interface. Kisspeptin affects trophoblastic migration and has antioxidant and immunomodulatory activities. This study aimed to evaluate the therapeutic potential of kisspeptin in the fetal-placental dysfunction of hypothyroid Wistar rats. Hypothyroidism was induced by daily administration of propylthiouracil. Kisspeptin-10 (Kp-10) treatment was performed every other day or daily beginning on day 8 of gestation. Feto-placental development, placental histomorphometry, and expression levels of growth factors (VEGF, PLGF, IGF1, IGF2, and GLUT1), hormonal (Dio2) and inflammatory mediators (TNFα, IL10, and IL6), markers of hypoxia (HIF1α) and oxidative damage (8-OHdG), antioxidant enzymes (SOD1, Cat, and GPx1), and endoplasmic reticulum stress mediators (ATF4, GRP78, and CHOP) were evaluated on day 18 of gestation. Daily treatment with Kp-10 increased free T3 and T4 levels and improved fetal weight. Both treatments reestablished the glycogen cell population in the junctional zone. Daily treatment with Kp-10 increased the gene expression levels of Plgf, Igf1, and Glut1 in the placenta of hypothyroid animals, in addition to blocking the increase in 8-OHdG and increasing protein and/or mRNA expression levels of SOD1, Cat, and GPx1. Daily treatment with Kp-10 did not alter the higher protein expression levels of VEGF, HIF1α, IL10, GRP78, and CHOP caused by hypothyroidism in the junctional zone compared to control, nor the lower expression of Dio2 caused by hypothyroidism. However, in the labyrinth zone, this treatment restored the expression of VEGF and IL10 and reduced the GRP78 and CHOP immunostaining. These findings demonstrate that daily treatment with Kp-10 improves fetal development and placental morphology in hypothyroid rats, blocks placental oxidative damage, and increases the expression of growth factors and antioxidant enzymes in the placenta.
Keywords: cell stress; fetal development; inflammation; kisspeptin; rat; thyroid; trophoblast.
Copyright © 2022 Santos, dos Anjos Cordeiro, Santos, Barbosa, Mendonça, Santos, de Macedo, de Lavor, Szawka, Serakides and Silva.
Conflict of interest statement
The authors declare that the research was conducted in the absence of any commercial or financial relationships that could be construed as a potential conflict of interest.
Figures
Similar articles
-
Kisspeptin-10 Improves Testicular Redox Status but Does Not Alter the Unfolded Protein Response (UPR) That Is Downregulated by Hypothyroidism in a Rat Model.Int J Mol Sci. 2024 Jan 26;25(3):1514. doi: 10.3390/ijms25031514. Int J Mol Sci. 2024. PMID: 38338793 Free PMC article.
-
Manganese porphyrin-based treatment improves fetal-placental development and protects against oxidative damage and NLRP3 inflammasome activation in a rat maternal hypothyroidism model.Redox Biol. 2024 Aug;74:103238. doi: 10.1016/j.redox.2024.103238. Epub 2024 Jun 11. Redox Biol. 2024. PMID: 38870780 Free PMC article.
-
Maternal hypothyroidism causes oxidative stress and endoplasmic reticulum stress in the maternal-fetal interface of rats.Free Radic Biol Med. 2022 Oct;191:24-39. doi: 10.1016/j.freeradbiomed.2022.08.033. Epub 2022 Aug 26. Free Radic Biol Med. 2022. PMID: 36038036
-
Potential roles for the kisspeptin/kisspeptin receptor system in implantation and placentation.Hum Reprod Update. 2019 May 1;25(3):326-343. doi: 10.1093/humupd/dmy046. Hum Reprod Update. 2019. PMID: 30649364 Free PMC article. Review.
-
Regulation of Pregnancy: Evidence for Major Roles by the Uterine and Placental Kisspeptin/KISS1R Signaling Systems.Semin Reprod Med. 2019 Jul;37(4):182-190. doi: 10.1055/s-0039-3400966. Epub 2020 Jan 23. Semin Reprod Med. 2019. PMID: 31972863 Review.
Cited by
-
Kisspeptin treatment reverses high prolactin levels and improves gonadal function in hypothyroid male rats.Sci Rep. 2023 Oct 5;13(1):16819. doi: 10.1038/s41598-023-44056-z. Sci Rep. 2023. PMID: 37798396 Free PMC article.
-
Methimazole-Induced Hypothyroidism Increases the Content of Glycogen and Changes the Expression of LDH, GLUT4, and Aromatase in the Pregnant Uterus of Rabbits.Metabolites. 2025 Jan 30;15(2):82. doi: 10.3390/metabo15020082. Metabolites. 2025. PMID: 39997707 Free PMC article.
-
Associations between maternal urinary kisspeptin in late pregnancy and decreased fetal growth: a pregnancy-birth cohort study.Front Endocrinol (Lausanne). 2024 Jan 22;15:1257248. doi: 10.3389/fendo.2024.1257248. eCollection 2024. Front Endocrinol (Lausanne). 2024. PMID: 38318290 Free PMC article.
-
Kisspeptin-10 Improves Testicular Redox Status but Does Not Alter the Unfolded Protein Response (UPR) That Is Downregulated by Hypothyroidism in a Rat Model.Int J Mol Sci. 2024 Jan 26;25(3):1514. doi: 10.3390/ijms25031514. Int J Mol Sci. 2024. PMID: 38338793 Free PMC article.
-
Kisspeptin Suppresses Inflammasome-NLRP3 Activation and Pyroptosis Caused by Hypothyroidism at the Maternal-Fetal Interface of Rats.Int J Mol Sci. 2023 Apr 6;24(7):6820. doi: 10.3390/ijms24076820. Int J Mol Sci. 2023. PMID: 37047793 Free PMC article.
References
Publication types
MeSH terms
Substances
LinkOut - more resources
Full Text Sources
Medical
Research Materials
Miscellaneous