. 2022 Jul 29:4:829195.
doi: 10.3389/fspor.2022.829195. eCollection 2022.

Repeated practice runs during on-snow training do not generate any measurable neuromuscular alterations in elite alpine skiers

Affiliations

Repeated practice runs during on-snow training do not generate any measurable neuromuscular alterations in elite alpine skiers

Marine Alhammoud et al. Front Sports Act Living. .

Abstract

Background: Alpine skiers typically train using repeated practice runs requiring high bursts of muscle activity but there is little field-based evidence characterizing neuromuscular function across successive runs.

Purpose: To examine the impact of repeated ski runs on electromyographic activity (EMG) of the knee extensors and flexors in elite alpine skiers.

Methods: Nineteen national team alpine skiers were tested during regular ski training [Slalom (SL), Giant Slalom (GS), Super Giant Slalom and Downhill (Speed)] for a total of 39 training sessions. The surface EMG of the vastus lateralis (VL), rectus femoris (RF), vastus medialis (VM), biceps femoris (BF) and semimembranosus/semitendinosus (SMST) muscles was continuously recorded along with right knee and hip angles. The EMG root mean square signal was normalized to a maximal voluntary contraction (%MVC). The first and fourth runs of the training session were compared.

Results: There was no meaningful main effect of run on EMG relative activation time or mean power frequency beyond the skier's intrinsic variability. However, EMG activity of the vastii increased from the first to the fourth run in SL [VM, ~+3%MVC for IL and outside leg (OL), p = 0.035)], speed (VL, IL:+6%/OL:+11%, p = 0.015), and GS (VM, IL:0/OL:+7%, p < 0.001); the later with an interaction with leg (p < 0.001) due to a localized increase on the OL. The run time and turn time did not change from the first to the fourth run. There were no meaningful changes in angular velocities, amplitude of movement, or maximal and minimal angles.

Conclusion: Neuromuscular activity remains highly stable in elite skiers with low variability across four runs.

Keywords: alpine ski; elite athlete; injury prevention; muscle fatigue; surface electromyogram; variability; winter sport.


Conflict of interest statement

The authors declare that the research was conducted in the absence of any commercial or financial relationships that could be construed as a potential conflict of interest.

Figures

Figure 1
Figure 1
Illustration of a time-normalized ski cycle. This double turn is composed of a right turn (i.e., inside leg, IL, 0–50%) and a left turn (i.e., outside leg, OL, 50–100%), for the EMG activity in vastus lateralis (VL). Example from one World Cup skier during a session of Giant Slalom from run one to four. Each run represents the average of all cycles within a run (minus the first and last cycles). The shaded gray zones representing the edge changing phases (“unloading” phases ranged 0–10, 40–60, and 90–100% of the cycle) were discarded from the EMG analyses. MVC, maximum voluntary contraction; RMS, EMG amplitude in root mean square value over 125-ms epoch. The turn switch is materialized by the black dotted line at 50% of the cycle, at the minima of the resultant acceleration (AccR).
Figure 2
Figure 2
Activation time during the first (blue) and last (red) run across all skier-sessions (n = 39). Left: absolute values in ms. Right: relative values in percentage of the turn duration. Values are mean and 95% confidence intervals for the inside (IL) and outside (OL) leg. SL, Slalom; GS, Giant Slalom; Speed, Super Giant Slalom and Downhill; VM, vastus medialis; RF, rectus femoris; BF, biceps femoris; SMST, semi-membranosus – semi tendinosus. Due to the similarities between both vastii, only the medial head is represented. # difference between IL and OL, * difference between first and last run, $ interaction effect, §Post hoc of the interaction showing the difference between first and last run on a single leg. ***, ###, $$$, §§§p < 0.001; §§, ## p < 0.01; *, $ p < 0.05; (*) p < 0.10. The raincloud plot visualizes raw data (one point per right and left turn, i.e., inside and outside leg, respectively), probability density (cloud), and key summary statistics of the mean ± 95% confidence intervals. Each skier-session counts a certain amount of turns (right turn, inside leg; left turn, outside leg) composing run one and four. Each individual dot represents the value of the variable for a given right and left turn (inside and outside leg, respectively). The dotted line in blue and red between the two rainclouds of each discipline's subplot links the inside and outside legs of the first and last run, respectively.
Figure 3
Figure 3
Electromyographic (RMS) activity during the first (blue) and last (red) run across all skier-sessions (n = 39). Values are RMS activity in percentage of MVC for the inside (IL) and outside (OL) leg. Due to the similarities between both vastii, only the medial head is represented. SL, Slalom; GS, Giant Slalom; Speed, Super Giant Slalom and Downhill. #Difference between IL and OL, * difference between first and last run, $ interaction effect, §Post hoc of the interaction showing the difference between first and last run on a single leg. ***, ###, §§§, $$$ p < 0.001; *, $, §p < 0.05; ($), (*) p < 0.10. The raincloud plot visualizes raw data (one point per right and left turn, i.e., inside and outside leg, respectively), probability density (cloud), and the key summary statistics of the mean ± 95% confidence intervals. Each skier-session counts a certain number of turns (right turn, inside leg; left turn, outside leg) composing run one and four. Each individual dot represents the value of the variable for a given right and left turn (inside and outside leg, respectively). The dotted line in blue and red between the two rainclouds of each discipline's subplot links the inside and outside legs of the first and last run, respectively.
Figure 4
Figure 4
Median Power Frequency (MPF) of the electromyographic activity during first (blue) and last (red) run across all skier-sessions (n = 39). MPF values in Hz for the inside (IL) and outside (OL) leg. Due to the similarities between both vastii, only the medial head is represented. SL, Slalom; GS, Giant Slalom; Speed, Super Giant Slalom and Downhill. #Difference between IL and OL, *difference between first and last run. ### p < 0.001; **, ## p < 0.01; (#), (*) p < 0.10. The raincloud plot visualizes raw data (one point per right and left turn, i.e., inside or outside leg, respectively), probability density (cloud), and key summary statistics of the mean ± 95% confidence intervals. Each skier-session counts a certain amount of turns (right turn, inside leg; left turn, outside leg) composing run one and four. Each individual dot represents the value of the variable for a given right and left turn (inside and outside leg, respectively). The dotted line in blue and red between the two rainclouds of each discipline's subplot links the inside and outside legs of the first and last run, respectively.
Figure 5
Figure 5
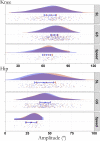
Raincloud of the average amplitude of movement in degrees for the knee and hip (180° full extension) during the first (blue) and last (red) run across all skier-sessions (n = 39). SL, Slalom; GS, Giant Slalom; Speed, Super Giant Slalom and Downhill. No statistical differences between first and last run (all p ≥ 0.106). The raincloud plot visualizes raw data (a point per cycle), probability density (cloud), and key summary statistics of the mean ± 95% confidence intervals. Each skier-session includes a certain number of cycles (double turns) composing runs one and four. Each individual dot represents the value of the amplitude for a given cycle, i.e., a double turn with an inside plus outside leg turn. SL Slalom, GS Giant Slalom, Speed Super Giant Slalom and Downhill. No statistical differences between first and last (all p ≥ 0.106).
Figure 6
Figure 6
Minimal and maximal angle of the knee and hip during the first (blue) and last (red) run across all skier-sessions (n = 39). Values in degrees for the inside (IL) and outside (OL) leg. SL, Slalom; GS, Giant Slalom; Speed, Super Giant Slalom and Downhill. #Difference between IL and OL, *difference between first and last run, $ interaction effect, § Post hoc of the interaction showing the difference between first and last run on a single leg. ### p < 0.001; $$ p < 0.01; * p < 0.05; ($), (§) p < 0.10. The raincloud plot visualizes raw data (one point per right and left turn, i.e., inside and outside leg, respectively), probability density (cloud), and key summary statistics of the mean ± 95% confidence intervals. Each skier-session counts a certain number of turns (right turn, inside leg; left turn, outside leg) composing run one and four. Each individual dot represents the value of the variable for a given right and left turn (inside and outside leg, respectively). The dotted line in blue and red between the two rainclouds of each discipline's subplot links the inside and outside legs of the first and last run, respectively.
Figure 7
Figure 7
Peak angular velocity of the knee and hip during the first (blue) and last (red) run across all skier-sessions (n = 39). Values in degrees per second for the inside (IL) and outside (OL) leg. Due to the similarities between both vastii, only the medial head is represented. SL: Slalom, GS: Giant Slalom, Speed: Super Giant Slalom and Downhill. #Difference between IL and OL, *difference between first and last run. ### p < 0.001, * p < 0.05, (#) p < 0.10. A negative angular velocity indicates a knee/hip flexion. The raincloud plot visualizes raw data (one point per right and left turn, i.e., inside or outside leg, respectively), probability density (cloud), and key summary statistics of the mean ± 95% confidence intervals. Each skier-session counts a certain number of turns (right turn, inside leg; left turn, outside leg) composing run one and four. Each individual dot represents the value of the variable for a given right and left turn (inside or outside leg, respectively). The dotted line in blue and red between the two rainclouds of each discipline's subplot links the inside and outside legs of the first and last run, respectively.

Similar articles

Cited by

References

    1. Akutsu T., Kiryu T., Ushiyama Y., Murayama T. (2008). Evaluation of functional activities during skiing exercise by knee joint angles and surface EMG signals. Trans. Soc. Instrum. Control Eng. 44, 905–910. 10.9746/ve.sicetr1965.44.905 - DOI
    1. Alhammoud M., Hansen C., Meyer F., Hautier C., Morel B. (2020). On-field ski kinematic according to leg and discipline in elite alpine skiers. Front. Sports Act. Living 2, 56. 10.3389/fspor.2020.00056 - DOI - PMC - PubMed
    1. Alhammoud M., Morel B., Girard O., Racinais S., Sevrez V., Germain A., et al. . (2018). Hypoxia and fatigue impair rapid torque development of knee extensors in elite alpine skiers. Front. Physiol. 9, 962. 10.3389/fphys.2018.00962 - DOI - PMC - PubMed
    1. Alhammoud M., Morel B., Hansen C., Wilson M., Mecca R., Nael E., et al. . (2019). Discipline and sex differences in angle-specific isokinetic analysis in elite skiers. Int. J. Sports Med. 40, 317–330. 10.1055/a-0850-0016 - DOI - PubMed
    1. Alhammoud M., Oksa J., Morel B., Hansen C., Chastan D., Racinais S. (2021a). Thermoregulation and shivering responses in elite alpine skiers. Eur. J. Sport Sci. 21, 400–411. 10.1080/17461391.2020.1754470 - DOI - PubMed