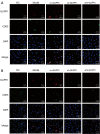
GLIPR1 regulates the TIMP1-CD63-ITGB1-AKT signaling pathway in glioma cells and induces malignant transformation of astroglioma
- PMID: 35966296
- PMCID: PMC9372201
- DOI: 10.21037/tcr-21-2413
GLIPR1 regulates the TIMP1-CD63-ITGB1-AKT signaling pathway in glioma cells and induces malignant transformation of astroglioma
Abstract
Background: Astrocytoma (ACM) is characterized by high recurrence rate, high mortality, and extremely poor clinical prognosis. The new diagnostic and prognostic tumor markers related to ACM was found to improve the diagnosis rate and reduce the poor prognosis.
Methods: The activity of SHC-44 and SW1783 cells under the regulation of glioma pathogenesis-related protein 1 (GLIPR1) was investigated by CCK8 analysis. The effect of GLIPR1 on the proliferation of SHC-44 and SW1783 cells was analyzed by cell colony-forming experiment. The migration of SHC-44 and SW1783 cells under the regulation of GLIPR1 was analyzed by transwell assay. The effects of GLIPR1 on the invasion and migration of SHC-44 and SW1783 cells were analyzed by cell scratch test and transwell assay. Immunofluorescence and Co-IP assays were employed to analyze the expression characteristics of GLIPR1 and CD63 proteins. The effect of GLIPR1 on the protein expression of GLIPR1, TIMP1, CD63, ITGB1, and AKT in SHC-44 and SW1783 cells was analyzed by western blot. The effect of anti-AKT on the protein expression of GLIPR1, TIMP1, CD63, ITGB1, and AKT in SHC-44 and SW1783 cells was performed by western blot.
Results: The outcomes revealed that GLIPR1 could enhance the activity, proliferation, migration, and invasion of ACM cells, which might be associated with the activation of the TIMP1-CD63-ITGB1-AKT signaling pathway.
Conclusions: Taken together, GLIPR1 might be a potential target for the prevention or management of ACM in the clinic.
Keywords: Glioma pathogenesis-related protein 1 (GLIPR1); TIMP1-CD63-ITGB1-AKT; astroglioma; invasion; migration.
2022 Translational Cancer Research. All rights reserved.
Conflict of interest statement
Conflicts of Interest: All authors have completed the ICMJE uniform disclosure form (available at https://tcr.amegroups.com/article/view/10.21037/tcr-21-2413/coif). The authors have no conflicts of interest to declare.
Figures


Similar articles
-
Timp1 interacts with beta-1 integrin and CD63 along melanoma genesis and confers anoikis resistance by activating PI3-K signaling pathway independently of Akt phosphorylation.Mol Cancer. 2013 Mar 25;12:22. doi: 10.1186/1476-4598-12-22. Mol Cancer. 2013. PMID: 23522389 Free PMC article.
-
Integrin β1 regulates proliferation, apoptosis, and migration of trophoblasts through activation of phosphoinositide 3 kinase/protein kinase B signaling.J Obstet Gynaecol Res. 2021 Jul;47(7):2406-2416. doi: 10.1111/jog.14782. Epub 2021 Apr 11. J Obstet Gynaecol Res. 2021. PMID: 33843127
-
TPX2-p53-GLIPR1 regulatory circuitry in cell proliferation, invasion, and tumor growth of bladder cancer.J Cell Biochem. 2018 Feb;119(2):1791-1803. doi: 10.1002/jcb.26340. Epub 2017 Sep 11. J Cell Biochem. 2018. PMID: 28799673
-
Glioma pathogenesis-related protein 1 performs dual functions in tumor cells.Cancer Gene Ther. 2022 Mar;29(3-4):253-263. doi: 10.1038/s41417-021-00321-9. Epub 2021 Mar 19. Cancer Gene Ther. 2022. PMID: 33742130 Review.
-
Glioma pathogenesis-related protein 1: tumor-suppressor activities and therapeutic potential.Yonsei Med J. 2010 Jul;51(4):479-83. doi: 10.3349/ymj.2010.51.4.479. Yonsei Med J. 2010. PMID: 20499410 Free PMC article. Review.
Cited by
-
CAP superfamily proteins in human: a new target for cancer therapy.Med Oncol. 2024 Nov 5;41(12):306. doi: 10.1007/s12032-024-02548-6. Med Oncol. 2024. PMID: 39499355 Review.
-
Identification and validation of an ECM organization-related gene signature as a prognostic biomarker and therapeutic target for glioma patients.Genes Genomics. 2023 Sep;45(9):1211-1226. doi: 10.1007/s13258-023-01413-6. Epub 2023 Jun 10. Genes Genomics. 2023. PMID: 37301776
References
LinkOut - more resources
Full Text Sources
Research Materials
Miscellaneous
