Development of novel gene signatures for the risk stratification of prognosis and diagnostic prediction of osteosarcoma patients using bioinformatics analysis
- PMID: 35966307
- PMCID: PMC9372256
- DOI: 10.21037/tcr-22-1706
Development of novel gene signatures for the risk stratification of prognosis and diagnostic prediction of osteosarcoma patients using bioinformatics analysis
Abstract
Background: Osteosarcoma (OS) is a common malignant bone cancer in children and teenagers that originates from osteoblast cells. Although many biomarkers have been reported in OS, they have not improved the prognosis of this disease. This study sought to identify effective biomarkers for the early diagnosis and prognosis of OS using a comprehensive bioinformatics analysis.
Methods: OS-associated microRNAs (miRNAs) were screened in the Human microRNA Disease Database (HMDD). The differentially expressed genes (DEGs) related to OS were screened using 3 data sets (GSE16088, GSE36001, and GSE56001) from the Gene Expression Omnibus (GEO) database. By comparing the targets of these miRNAs with DEGs in response to OS, we identified OS-associated candidate genes. The gene expression and clinical data of 96 OS samples with complete clinical information was downloaded from the Therapeutically Applicable Research to Generate Effective Treatments (TARGET) database. Comprehensive bioinformatics analyses, including univariate, multivariate Cox, and Kaplan-Meier (KM) analyses were conducted based on these data to identify the prognostic genes and construct prognostic signature for OS survival and recurrence. Logistic regression analysis was performed based on the GSE42352 data set (including 103 OS and 15 normal samples) to develop a diagnostic model for OS.
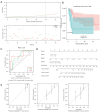
Results: By comparing the DEGs and predicted targets of the 28 OS survival-associated miRNAs, we identified 267 OS-associated candidate genes. Additionally, 14 genes were found to be significantly associated with the survival of OS patients. Finally, 3 genes [i.e., signal transducer and activators of transcription factor 4 (STAT4), heat shock protein family E member 1 (HSPE1), and actin-related protein 2/3 complex subunit 5 (ARPC5)] were integrated into a prognostic index. The 3-gene signature was an independent factor for OS survival [hazard ratio (HR) =1.699; P<0.001] and recurrence (HR =2.532; P=0.004) and was found to have an excellent predictive performance [area under the receiver operating characteristic (ROC) curve (AUC) >0.7]. Additionally, 2 genes (i.e., STAT4 and HSPE1) were identified to be associated with OS diagnosis (P<0.05). This 2-gene diagnostic signature for OS presented a good discriminative power (AUC =0.981) and the error between the predicted and actual value was 0.029.
Conclusions: We constructed a 3-gene prognostic signature and a 2-gene diagnostic signature that have the potential to assist in prognosis predicting and diagnosis of OS in clinic.
Keywords: Prognostic signature; biomarker; diagnosis; osteosarcoma (OS); recurrence.
2022 Translational Cancer Research. All rights reserved.
Conflict of interest statement
Conflicts of Interest: All authors have completed the ICMJE uniform disclosure form (available at https://tcr.amegroups.com/article/view/10.21037/tcr-22-1706/coif). The authors have no conflicts of interest to declare.
Figures


Similar articles
-
Prioritizing Context-Dependent Cancer Gene Signatures in Networks.Cancers (Basel). 2025 Jan 3;17(1):136. doi: 10.3390/cancers17010136. Cancers (Basel). 2025. PMID: 39796763 Free PMC article. Review.
-
Prognostic Signature in Osteosarcoma Based on Amino Acid Metabolism-Associated Genes.Cancer Biother Radiopharm. 2024 Sep;39(7):517-531. doi: 10.1089/cbr.2024.0002. Epub 2024 Mar 21. Cancer Biother Radiopharm. 2024. PMID: 38512709
-
Construction of a novel mRNA-signature prediction model for prognosis of bladder cancer based on a statistical analysis.BMC Cancer. 2021 Jul 27;21(1):858. doi: 10.1186/s12885-021-08611-z. BMC Cancer. 2021. PMID: 34315402 Free PMC article.
-
Identification of a three-gene expression signature and construction of a prognostic nomogram predicting overall survival in lung adenocarcinoma based on TCGA and GEO databases.Transl Lung Cancer Res. 2022 Jul;11(7):1479-1496. doi: 10.21037/tlcr-22-444. Transl Lung Cancer Res. 2022. PMID: 35958325 Free PMC article.
-
Signature constructed by glycolysis-immune-related genes can predict the prognosis of osteosarcoma patients.Invest New Drugs. 2022 Aug;40(4):818-830. doi: 10.1007/s10637-022-01228-4. Epub 2022 Apr 18. Invest New Drugs. 2022. PMID: 35435626 Review.
Cited by
-
Prioritizing Context-Dependent Cancer Gene Signatures in Networks.Cancers (Basel). 2025 Jan 3;17(1):136. doi: 10.3390/cancers17010136. Cancers (Basel). 2025. PMID: 39796763 Free PMC article. Review.
-
Screening and identification of susceptibility genes for osteosarcoma based on bioinformatics analysis.Ann Transl Med. 2023 Jan 31;11(2):87. doi: 10.21037/atm-22-6369. Ann Transl Med. 2023. PMID: 36819543 Free PMC article.
-
Construction of diagnostic and prognostic models based on gene signatures of nasopharyngeal carcinoma by machine learning methods.Transl Cancer Res. 2023 May 31;12(5):1254-1269. doi: 10.21037/tcr-22-2700. Epub 2023 Apr 10. Transl Cancer Res. 2023. PMID: 37304552 Free PMC article.
References
LinkOut - more resources
Full Text Sources
Miscellaneous
