

Automated risk assessment of newly detected atrial fibrillation poststroke from electronic health record data using machine learning and natural language processing
- PMID: 35966534
- PMCID: PMC9372298
- DOI: 10.3389/fcvm.2022.941237
Automated risk assessment of newly detected atrial fibrillation poststroke from electronic health record data using machine learning and natural language processing
Abstract
Background: Timely detection of atrial fibrillation (AF) after stroke is highly clinically relevant, aiding decisions on the optimal strategies for secondary prevention of stroke. In the context of limited medical resources, it is crucial to set the right priorities of extended heart rhythm monitoring by stratifying patients into different risk groups likely to have newly detected AF (NDAF). This study aimed to develop an electronic health record (EHR)-based machine learning model to assess the risk of NDAF in an early stage after stroke.
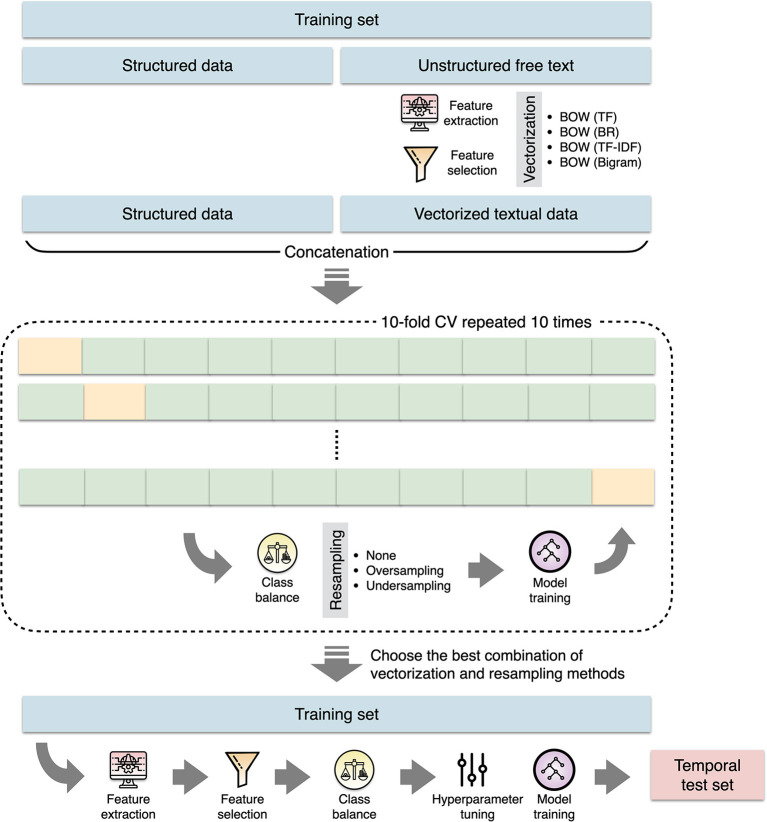
Methods: Linked data between a hospital stroke registry and a deidentified research-based database including EHRs and administrative claims data was used. Demographic features, physiological measurements, routine laboratory results, and clinical free text were extracted from EHRs. The extreme gradient boosting algorithm was used to build the prediction model. The prediction performance was evaluated by the C-index and was compared to that of the AS5F and CHASE-LESS scores.
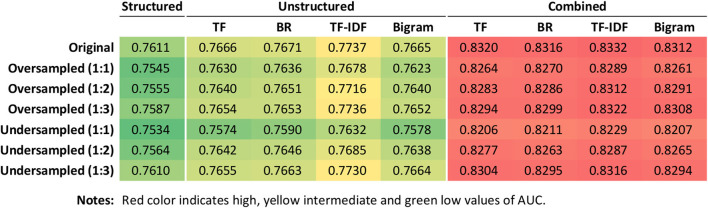
Results: The study population consisted of a training set of 4,064 and a temporal test set of 1,492 patients. During a median follow-up of 10.2 months, the incidence rate of NDAF was 87.0 per 1,000 person-year in the test set. On the test set, the model based on both structured and unstructured data achieved a C-index of 0.840, which was significantly higher than those of the AS5F (0.779, p = 0.023) and CHASE-LESS (0.768, p = 0.005) scores.
Conclusions: It is feasible to build a machine learning model to assess the risk of NDAF based on EHR data available at the time of hospital admission. Inclusion of information derived from clinical free text can significantly improve the model performance and may outperform risk scores developed using traditional statistical methods. Further studies are needed to assess the clinical usefulness of the prediction model.
Keywords: atrial fibrillation; electronic health records; ischemic stroke; natural language processing; prediction.
Copyright © 2022 Sung, Sung, Pan, Lee and Hu.
Conflict of interest statement
The authors declare that the research was conducted in the absence of any commercial or financial relationships that could be construed as a potential conflict of interest.
Figures


Similar articles
-
Validation of Risk Scores for Predicting Atrial Fibrillation Detected After Stroke Based on an Electronic Medical Record Algorithm: A Registry-Claims-Electronic Medical Record Linked Data Study.Front Cardiovasc Med. 2022 Apr 29;9:888240. doi: 10.3389/fcvm.2022.888240. eCollection 2022. Front Cardiovasc Med. 2022. PMID: 35571191 Free PMC article.
-
Development of a novel score to predict newly diagnosed atrial fibrillation after ischemic stroke: The CHASE-LESS score.Atherosclerosis. 2020 Feb;295:1-7. doi: 10.1016/j.atherosclerosis.2020.01.003. Epub 2020 Jan 13. Atherosclerosis. 2020. PMID: 31972497
-
Early Prediction of Functional Outcomes After Acute Ischemic Stroke Using Unstructured Clinical Text: Retrospective Cohort Study.JMIR Med Inform. 2022 Feb 17;10(2):e29806. doi: 10.2196/29806. JMIR Med Inform. 2022. PMID: 35175201 Free PMC article.
-
Prediction of incident atrial fibrillation in community-based electronic health records: a systematic review with meta-analysis.Heart. 2022 Jun 10;108(13):1020-1029. doi: 10.1136/heartjnl-2021-320036. Heart. 2022. PMID: 34607811 Free PMC article.
-
Use of risk scores for predicting new atrial fibrillation after ischemic stroke or transient ischemic attack-A systematic review.Int J Stroke. 2022 Jul;17(6):608-617. doi: 10.1177/17474930211045880. Epub 2021 Sep 22. Int J Stroke. 2022. PMID: 34551649
Cited by
-
Clinical applications of large language models in medicine and surgery: A scoping review.J Int Med Res. 2025 Jul;53(7):3000605251347556. doi: 10.1177/03000605251347556. Epub 2025 Jul 4. J Int Med Res. 2025. PMID: 40615349 Free PMC article.
-
Evaluating Machine Learning Models for Stroke Prognosis and Prediction in Atrial Fibrillation Patients: A Comprehensive Meta-Analysis.Diagnostics (Basel). 2024 Oct 26;14(21):2391. doi: 10.3390/diagnostics14212391. Diagnostics (Basel). 2024. PMID: 39518359 Free PMC article.
-
Clinical applications of artificial intelligence and machine learning in neurocardiology: a comprehensive review.Front Cardiovasc Med. 2025 Apr 3;12:1525966. doi: 10.3389/fcvm.2025.1525966. eCollection 2025. Front Cardiovasc Med. 2025. PMID: 40248254 Free PMC article. Review.
References
-
- Kang K, Park TH, Kim N, Jang MU, Park S-S, Park J-M, et al. . Recurrent stroke, myocardial infarction, and major vascular events during the first year after acute ischemic stroke: the multicenter prospective observational study about recurrence and its determinants after acute ischemic stroke I. J Stroke Cerebrovasc Dis. (2016) 25:656–64. 10.1016/j.jstrokecerebrovasdis.2015.11.036 - DOI - PubMed
LinkOut - more resources
Full Text Sources