. 2022 Jul 29:9:966028.
doi: 10.3389/fcvm.2022.966028. eCollection 2022.

Population-wide persistent hemostatic changes after vaccination with ChAdOx1-S

Affiliations

Population-wide persistent hemostatic changes after vaccination with ChAdOx1-S

Bas de Laat et al. Front Cardiovasc Med. .

Abstract

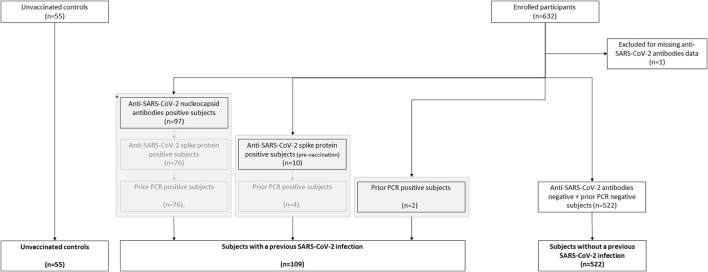
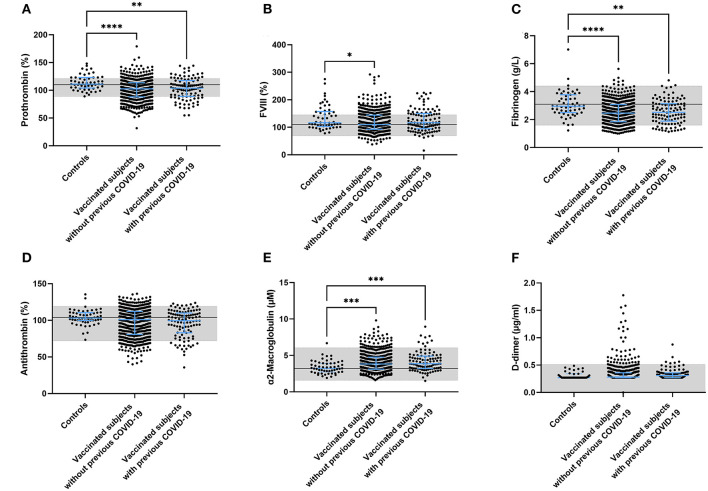
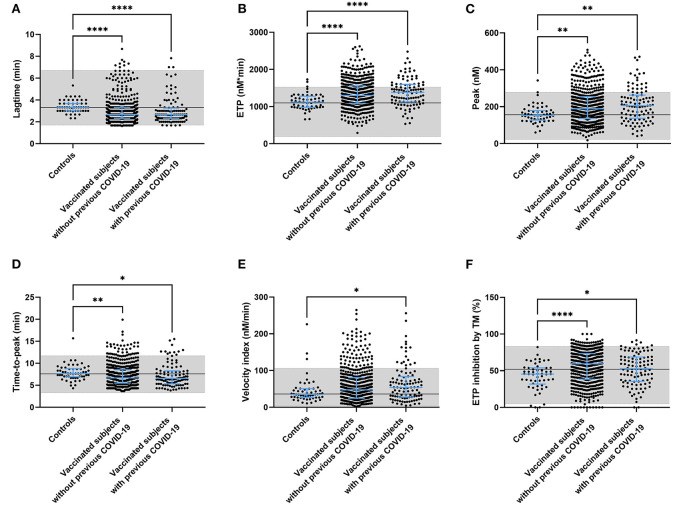
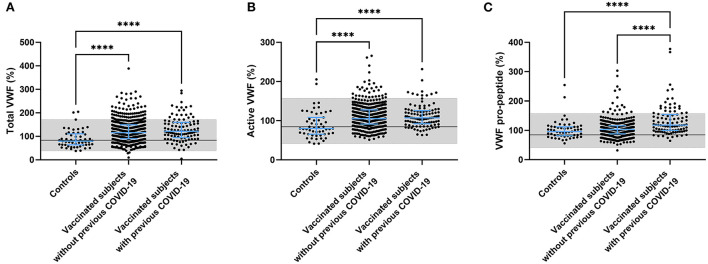
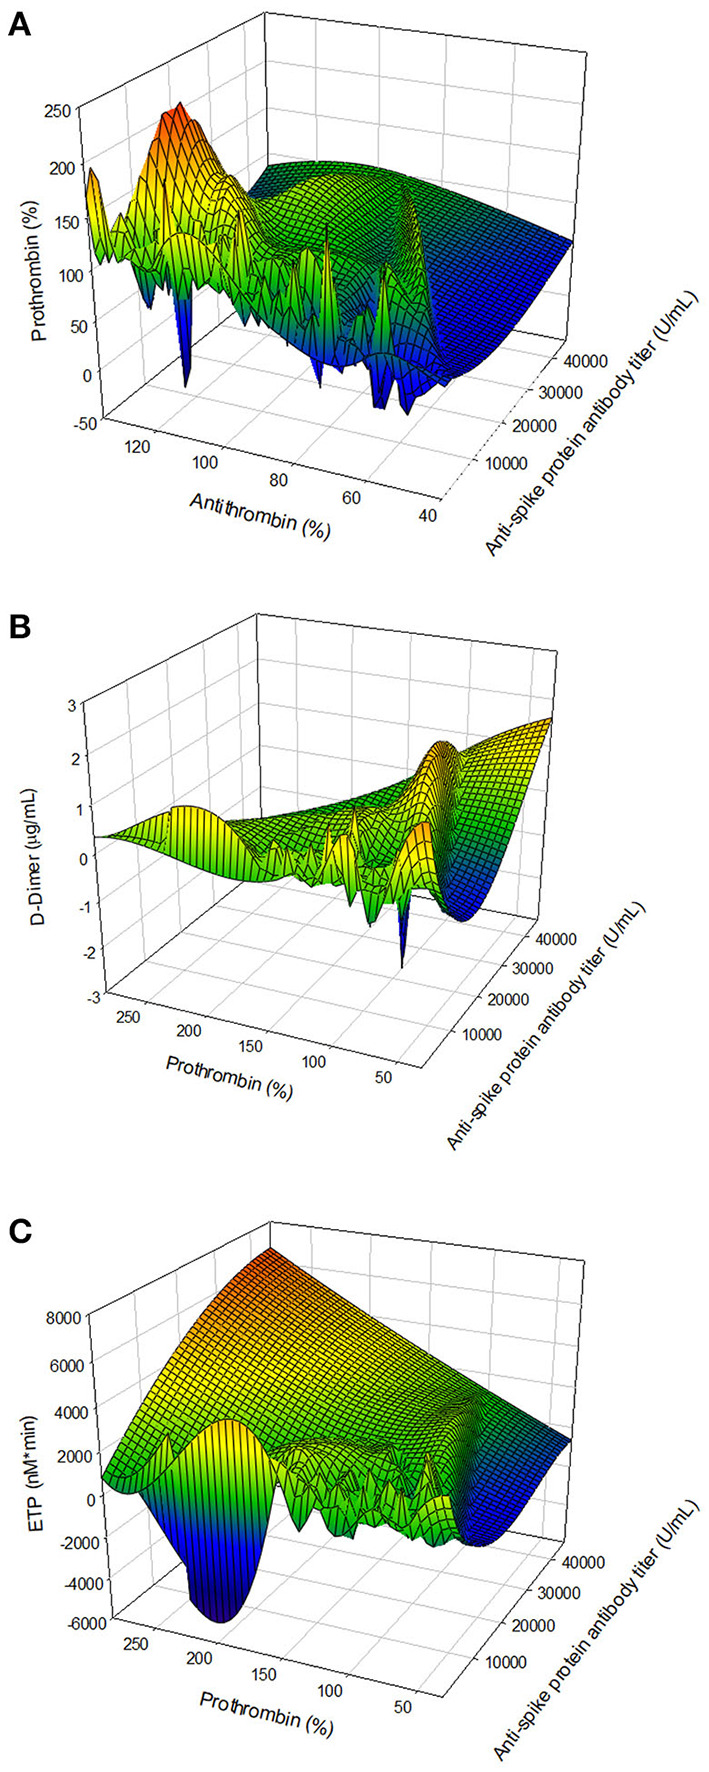
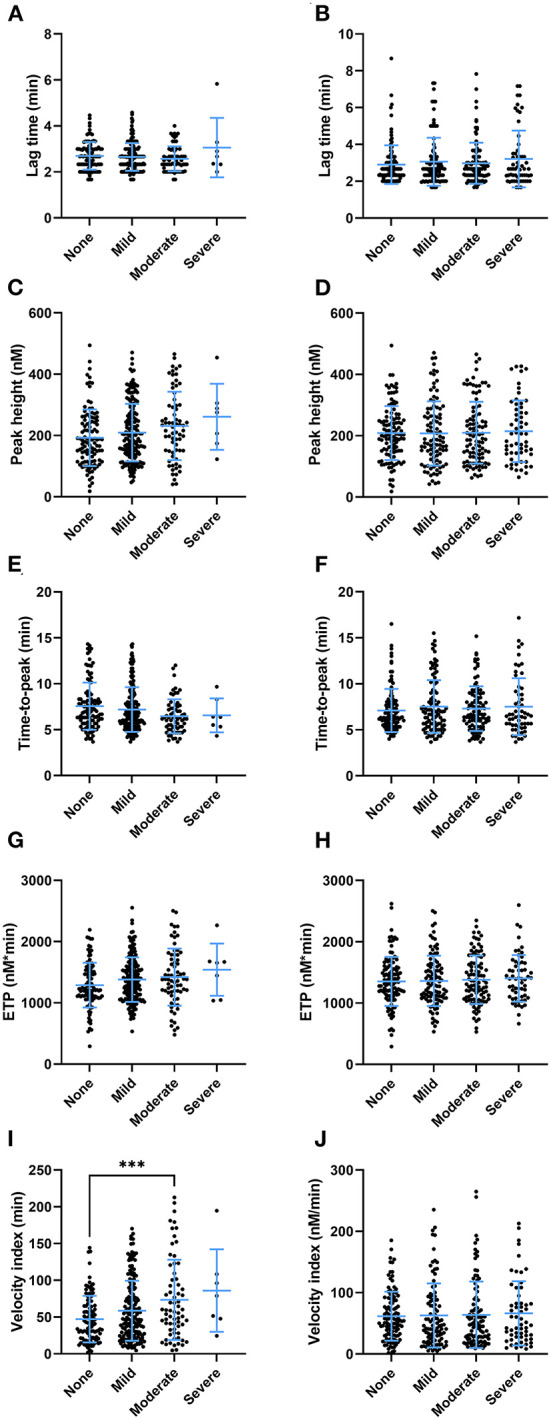
Various vaccines were developed to reduce the spread of the Severe Acute Respiratory Syndrome Cov-2 (SARS-CoV-2) virus. Quickly after the start of vaccination, reports emerged that anti-SARS-CoV-2 vaccines, including ChAdOx1-S, could be associated with an increased risk of thrombosis. We investigated the hemostatic changes after ChAdOx1-S vaccination in 631 health care workers. Blood samples were collected 32 days on average after the second ChAdOx1-S vaccination, to evaluate hemostatic markers such as D-dimer, fibrinogen, α2-macroglobulin, FVIII and thrombin generation. Endothelial function was assessed by measuring Von Willebrand Factor (VWF) and active VWF. IL-6 and IL-10 were measured to study the activation of the immune system. Additionally, SARS-CoV-2 anti-nucleoside and anti-spike protein antibody titers were determined. Prothrombin and fibrinogen levels were significantly reduced after vaccination (-7.5% and -16.9%, p < 0.0001). Significantly more vaccinated subjects were outside the normal range compared to controls for prothrombin (42.1% vs. 26.4%, p = 0.026) and antithrombin (23.9% vs. 3.6%, p = 0.0010). Thrombin generation indicated a more procoagulant profile, characterized by a significantly shortened lag time (-11.3%, p < 0.0001) and time-to-peak (-13.0% and p < 0.0001) and an increased peak height (32.6%, p = 0.0015) in vaccinated subjects compared to unvaccinated controls. Increased VWF (+39.5%, p < 0.0001) and active VWF levels (+24.1 %, p < 0.0001) pointed toward endothelial activation, and IL-10 levels were significantly increased (9.29 pg/mL vs. 2.43 pg/mL, p = 0.032). The persistent increase of IL-10 indicates that the immune system remains active after ChAdOx1-S vaccination. This could trigger a pathophysiological mechanism causing an increased thrombin generation profile and vascular endothelial activation, which could subsequently result in and increased risk of thrombotic events.

Keywords: COVID-19; ChAdOx1-S; hemostasis; thrombin generation; vaccination.


Conflict of interest statement

BL, RdL-K, MR, DH, and MN are employees of Synapse Research Institute, part of Diagnostica Stago. HC received funding for research from Bayer and Pfizer; compensation fees for consultancy and advisory boards from Daaichi, Pfizer, Leo, Bayer, Galapagos, Anthos, Alexion, and Alveron; shareholder from Coagulation profile; all benefits were transferred to the CARIM institute to support investigator-initiated research. The remaining authors declare that the research was conducted in the absence of any commercial or financial relationships that could be construed as a potential conflict of interest.

Figures

Figure 1
Figure 1
Flow chart of the classification of subjects vaccinated with ChAdOx1-S with and without prior COVID-19.
Figure 2
Figure 2
Coagulation factor levels in controls and subjects vaccinated with ChAdOx1-S with and without prior COVID-19 infection. Plasma levels of prothrombin (A), FVIII (B), fibrinogen (C), antithrombin (D), α2-macroglobulin (E) and D-dimer (F) were quantified. Reference values for each test are indicated as the gray area in the dot plot. Differences between the groups were analyzed by ANOVA or Kruskal-Wallis analysis, depending on the distribution of the data. P-values below 0.05, 0.01, 0.001, and 0.0001 were marked as *, **, ***, and ****, respectively.
Figure 3
Figure 3
Thrombin generation parameters in controls and subjects vaccinated with ChAdOx1-S with and without prior COVID-19 infection. Thrombin generation was measured at 5 pM tissue factor and the lag time (A), ETP (B), peak height (C), time-to-peak (D), velocity index (E), and the inhibition of the ETP by the addition of thrombomodulin (F) were quantified. Reference values for each parameter are indicated as the gray area in the dot plot. Differences between the groups were analyzed by ANOVA or Kruskal-Wallis analysis, depending on the distribution of the data. P-values below 0.05, 0.01, 0.001, and 0.0001 were marked as *, **, ***, and ****, respectively.
Figure 4
Figure 4
Endothelial activation in controls and subjects vaccinated with ChAdOx1-S with and without prior COVID-19 infection. Endothelial activation was assessed by the measurement of total VWF (A), active VWF (B) and VWF pro-peptide (C). Reference values for each test are indicated as the gray area in the dot plot. Differences between the groups were analyzed by ANOVA or Kruskal-Wallis analysis, depending on the distribution of the data. P-values below 0.05, 0.01, 0.001, and 0.0001 were marked respectively.
Figure 5
Figure 5
The association of the anti-SARS-CoV-2 spike protein antibody titer and hemostatic parameters. (A) The relationship antibody titer and coagulation factor levels: antithrombin and prothrombin. (B) The association of antibody titer and coagulation factor consumption: prothrombin and D-dimer. (C) The relation of antibody titer and the thrombin generation potential, quantified by the ETP and prothrombin level.
Figure 6
Figure 6
The association of thrombin generation parameters and clinical symptoms after the second round of vaccination as reported by subjects vaccinated with ChAdOx1-S with and without prior COVID-19 infection. (A,B) The lag time did not differ significantly at the increasing levels of injection site symptoms (A) or systemic symptoms (B). The peak height differed significantly between subjects with increasing injection site symptoms (p < 0.038), although the study was underpowered to detect differences between specific groups in post hoc analysis (C). Increasing systemic symptoms did not result in differences in peak height (D). (E,F) The time-to-peak differed significantly between the categories of injection site symptoms (p = 0.029) (E), but not systemic symptoms (F). (G,H) The ETP was not significantly affected by the various levels of injection site symptoms (G) or systemic symptoms (H). (I) The velocity index was significantly increased in subjects with more injection site symptoms (p < 0.001) (I), but not systemic symptoms (J). Data are displayed as mean and standard deviation or as percentages in the case of categorical variables. Differences between the groups were analyzed by ANOVA or Kruskal-Wallis analysis, depending on the distribution of the data. A p-value below 0.05 was considered statistically significant and *** indicates a p-value below 0.001.

References

    1. Tang N, Li D, Wang X, Sun Z. Abnormal coagulation parameters are associated with poor prognosis in patients with novel coronavirus pneumonia. J Thromb Haemost. (2020) 18:844–7. 10.1111/jth.14768 - DOI - PMC - PubMed
    1. J Medicine, JHU . COVID-19 Dashboard by the Center for Systems Science Engineering (CSSE) at Johns Hopkins University (JHU) (2020). Available online at: https://coronavirus.jhu.edu/map.html
    1. Falsey AR, Sobieszczyk ME, Hirsch I, Sproule S, Robb ML, Corey L, et al. . Phase 3 safety and efficacy of AZD1222 (ChAdOx1 nCoV-19) COVID-19 vaccine. N Engl J Med. (2021) 385:2348–60. 10.1056/NEJMoa2105290 - DOI - PMC - PubMed
    1. Sharma O, Sultan AA, Ding H, Triggle CR. Triggle A. Review of the progress and challenges of developing a vaccine for COVID-19. Front Immunol. (2020) 11:585354. 10.3389/fimmu.2020.585354 - DOI - PMC - PubMed
    1. Mascellino MT, Di Timoteo F, De Angelis M, Oliva A. Overview of the main anti-SARS-CoV-2 vaccines: mechanism of action, efficacy and safety. Infect Drug Resist. (2021) 14:3459–76. 10.2147/IDR.S315727 - DOI - PMC - PubMed