

Late plasma exosome microRNA-21-5p depicts magnitude of reverse ventricular remodeling after early surgical repair of primary mitral valve regurgitation
- PMID: 35966562
- PMCID: PMC9373041
- DOI: 10.3389/fcvm.2022.943068
Late plasma exosome microRNA-21-5p depicts magnitude of reverse ventricular remodeling after early surgical repair of primary mitral valve regurgitation
Abstract
Introduction: Primary mitral valve regurgitation (MR) results from degeneration of mitral valve apparatus. Mechanisms leading to incomplete postoperative left ventricular (LV) reverse remodeling (Rev-Rem) despite timely and successful surgical mitral valve repair (MVR) remain unknown. Plasma exosomes (pEXOs) are smallest nanovesicles exerting early postoperative cardioprotection. We hypothesized that late plasma exosomal microRNAs (miRs) contribute to Rev-Rem during the late postoperative period.
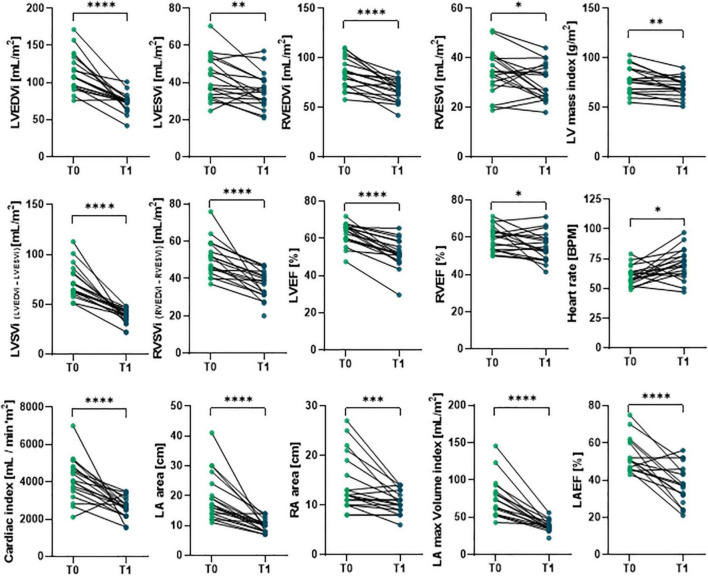
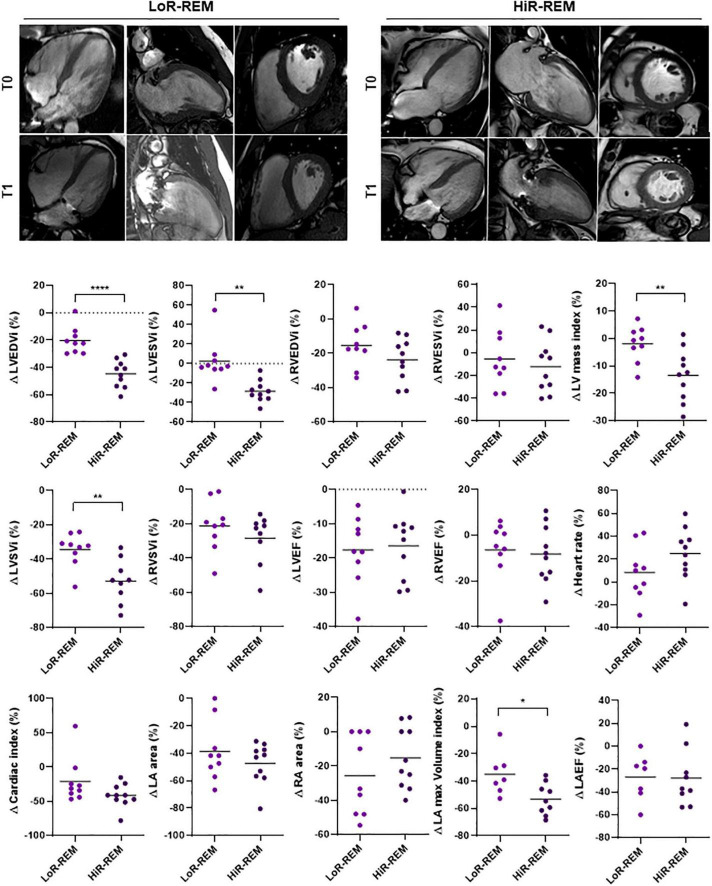
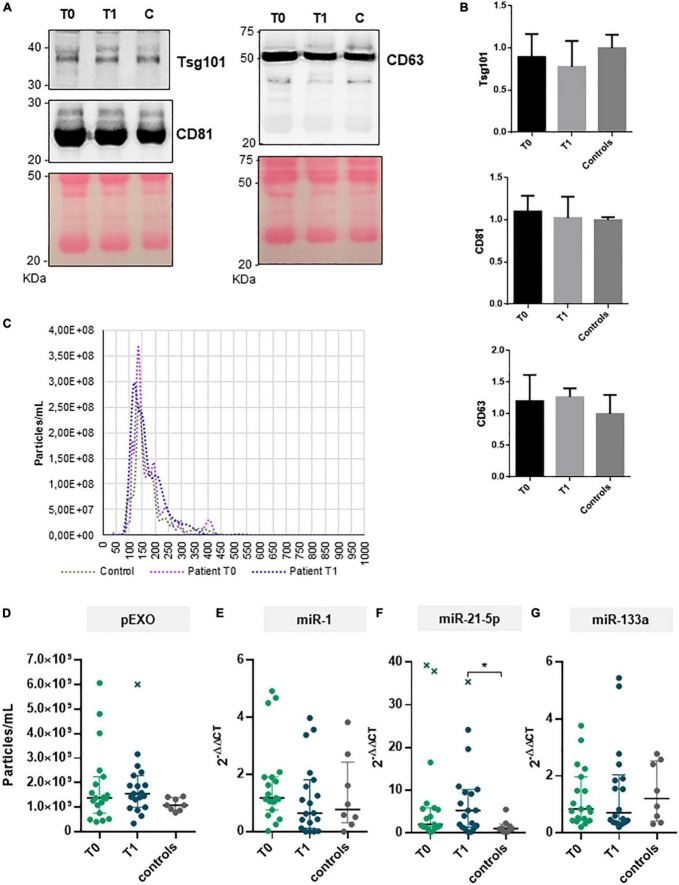
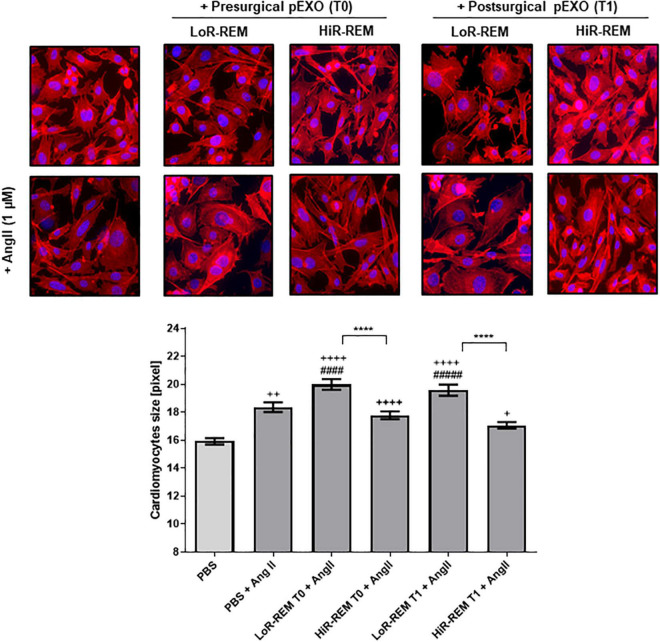
Methods: Primary MR patients (n = 19; age, 45-71 years) underwent cardiac magnetic resonance imaging and blood sampling before (T0) and 6 months after (T1) MVR. The postoperative LV Rev-Rem was assessed in terms of a decrease in LV end-diastolic volume and patients were stratified into high (HiR-REM) and low (LoR-REM) LV Rev-Rem subgroups. Isolated pEXOs were quantified by nanoparticle tracking analysis. Exosomal microRNA (miR)-1, -21-5p, -133a, and -208a levels were measured by RT-qPCR. Anti-hypertrophic effects of pEXOs were tested in HL-1 cardiomyocytes cultured with angiotensin II (AngII, 1 μM for 48 h).
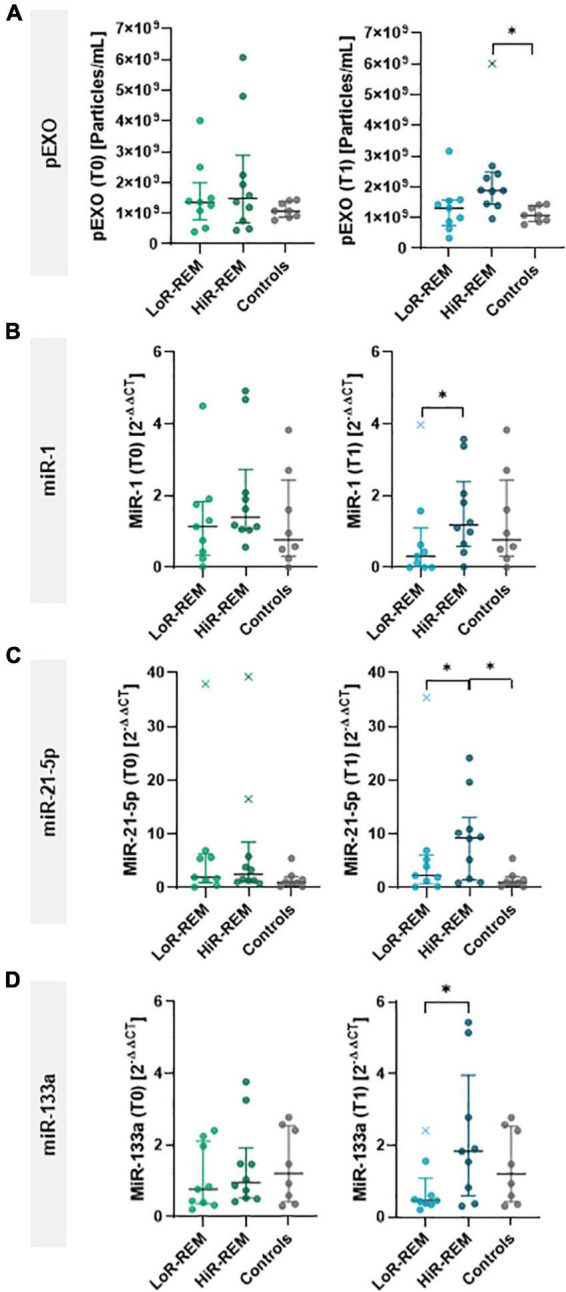
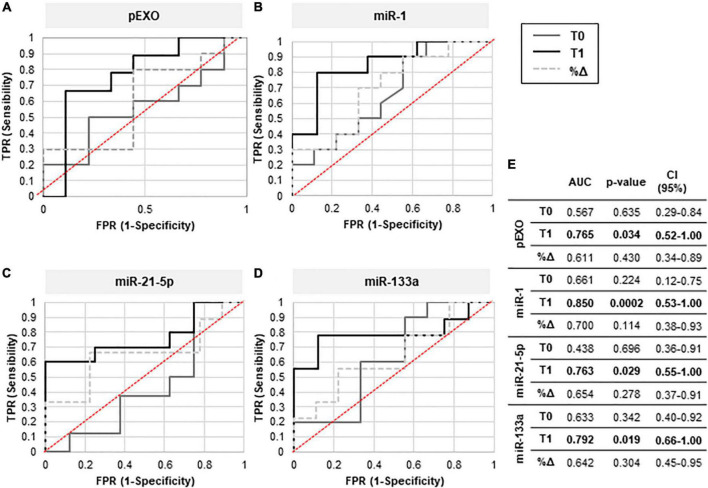
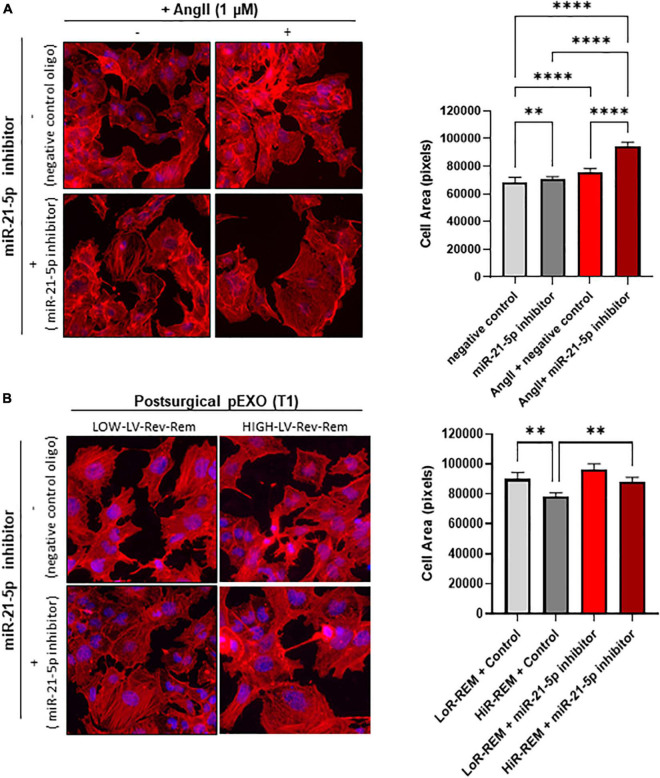
Results: Surgery zeroed out volume regurgitation in all patients. Although preoperative pEXOs were similar in both groups, pEXO levels increased after MVR in HiR-REM patients (+0.75-fold, p = 0.016), who showed lower cardiac mass index (-11%, p = 0.032). Postoperative exosomal miR-21-5p values of HiR-REM patients were higher than other groups (p < 0.05). In vitro, T1-pEXOs isolated from LoR-REM patients boosted the AngII-induced cardiomyocyte hypertrophy, but not postoperative exosomes of HiR-REM. This adaptive effect was counteracted by miR-21-5p inhibition.
Summary/conclusion: High levels of miR-21-5p-enriched pEXOs during the late postoperative period depict higher LV Rev-Rem after MVR. miR-21-5p-enriched pEXOs may be helpful to predict and to treat incomplete LV Rev-Rem after successful early surgical MVR.
Keywords: exosomes; heart surgery; miR-21-5p; mitral valve (MV) repair; postoperative; reverse remodeling.
Copyright © 2022 Pizzino, Furini, Casieri, Mariani, Bianchi, Storti, Chiappino, Maffei, Solinas, Aquaro and Lionetti.
Conflict of interest statement
The authors declare that the research was conducted in the absence of any commercial or financial relationships that could be construed as a potential conflict of interest.
Figures
Similar articles
-
Reduction of tethering distance by papillary muscle tugging approximation with mitral valve replacement for non-ischemic functional mitral regurgitation induces left ventricular reverse remodeling.J Cardiol. 2022 Apr;79(4):530-536. doi: 10.1016/j.jjcc.2021.10.017. Epub 2021 Nov 10. J Cardiol. 2022. PMID: 34774388
-
Mitral valve replacement with and without chordal preservation in patients with chronic mitral regurgitation. Mechanisms for differences in postoperative ejection performance.Circulation. 1992 Dec;86(6):1718-26. doi: 10.1161/01.cir.86.6.1718. Circulation. 1992. PMID: 1451243
-
Predictors of left ventricular remodeling after surgical repair or replacement for pure severe mitral regurgitation caused by leaflet prolapse.Am J Cardiol. 2013 Aug 15;112(4):567-73. doi: 10.1016/j.amjcard.2013.04.024. Epub 2013 May 16. Am J Cardiol. 2013. PMID: 23683949
-
Surgical Treatment of Ischemic Mitral Regurgitation: Valve Repair Versus Replacement.Curr Cardiol Rep. 2017 Jan;19(1):3. doi: 10.1007/s11886-017-0813-6. Curr Cardiol Rep. 2017. PMID: 28101839 Review.
-
Percutaneous transcatheter mitral valve repair: a classification of the technology.JACC Cardiovasc Interv. 2011 Jan;4(1):1-13. doi: 10.1016/j.jcin.2010.09.023. JACC Cardiovasc Interv. 2011. PMID: 21251623 Review.
Cited by
-
Cardiomyocyte-targeting exosomes from sulforaphane-treated fibroblasts affords cardioprotection in infarcted rats.J Transl Med. 2023 May 9;21(1):313. doi: 10.1186/s12967-023-04155-x. J Transl Med. 2023. PMID: 37161563 Free PMC article.
-
Exosomes and miRNAs in Cardiovascular Diseases and Transcatheter Pulmonary Valve Replacement: Advancements, Gaps and Perspectives.Int J Mol Sci. 2024 Dec 21;25(24):13686. doi: 10.3390/ijms252413686. Int J Mol Sci. 2024. PMID: 39769447 Free PMC article. Review.
-
The Role of Exosomes in Health and Disease.Int J Mol Sci. 2022 Sep 20;23(19):11011. doi: 10.3390/ijms231911011. Int J Mol Sci. 2022. PMID: 36232305 Free PMC article.
-
Coffee consumption and cardiometabolic health: a comprehensive review of the evidence.Geroscience. 2024 Dec;46(6):6473-6510. doi: 10.1007/s11357-024-01262-5. Epub 2024 Jul 4. Geroscience. 2024. PMID: 38963648 Free PMC article. Review.
-
Secreted miR-210-3p, miR-183-5p and miR-96-5p reduce sensitivity to docetaxel in prostate cancer cells.Cell Death Discov. 2023 Dec 8;9(1):445. doi: 10.1038/s41420-023-01696-4. Cell Death Discov. 2023. PMID: 38065937 Free PMC article.
References
-
- Scandura S, Mangiafico S, Giaquinta S. Mitral regurgitation: epidemiology, etiology and physiopathology. In: Tamburino C, Barbanti M, Capodanno D. editors. Percutaneous Treatment of Left Side Cardiac Valves: A Practical Guide for the Interventional Cardiologist. Cham: Springer International Publishing; (2018). p. 49–61. 10.1007/978-3-319-59620-4_3 - DOI
-
- Nishimura RA, Otto CM, Bonow RO, Carabello BA, Erwin JP, Fleisher LA, et al. 2017 AHA/ACC focused update of the 2014 AHA/ACC guideline for the management of patients with valvular heart disease: a report of the American college of cardiology/American heart association task force on clinical practice guidelines. Circulation. (2017) 135:e1159–95. 10.1161/CIR.0000000000000503 - DOI - PubMed
LinkOut - more resources
Full Text Sources