. 2022 Aug 8;12(13):5949-5970.
doi: 10.7150/thno.72826. eCollection 2022.

CRISPR/Cas9-based genome-wide screening for deubiquitinase subfamily identifies USP1 regulating MAST1-driven cisplatin-resistance in cancer cells

Affiliations

CRISPR/Cas9-based genome-wide screening for deubiquitinase subfamily identifies USP1 regulating MAST1-driven cisplatin-resistance in cancer cells

Apoorvi Tyagi et al. Theranostics. .

Abstract

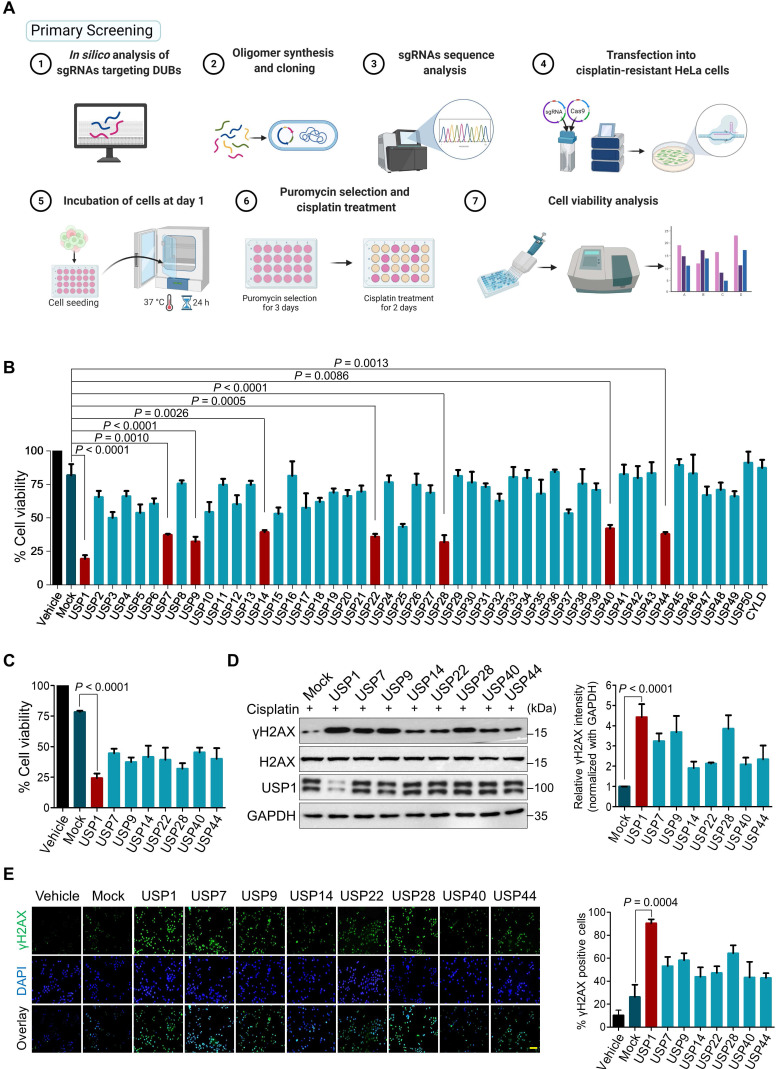
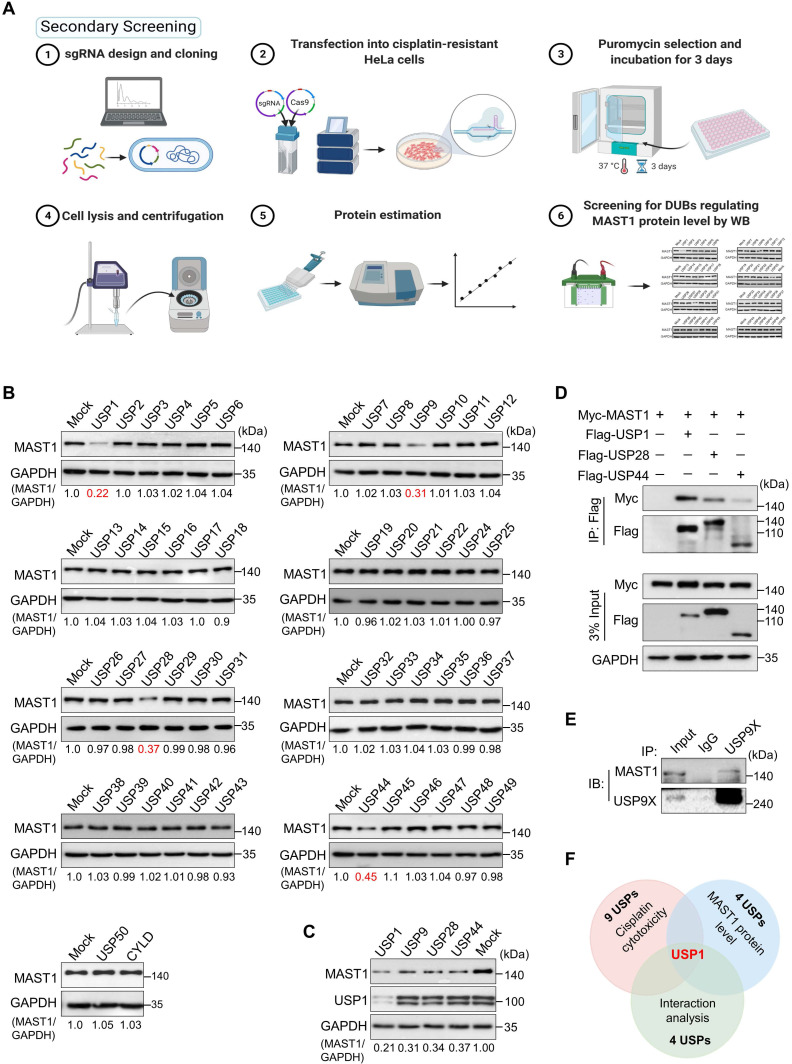
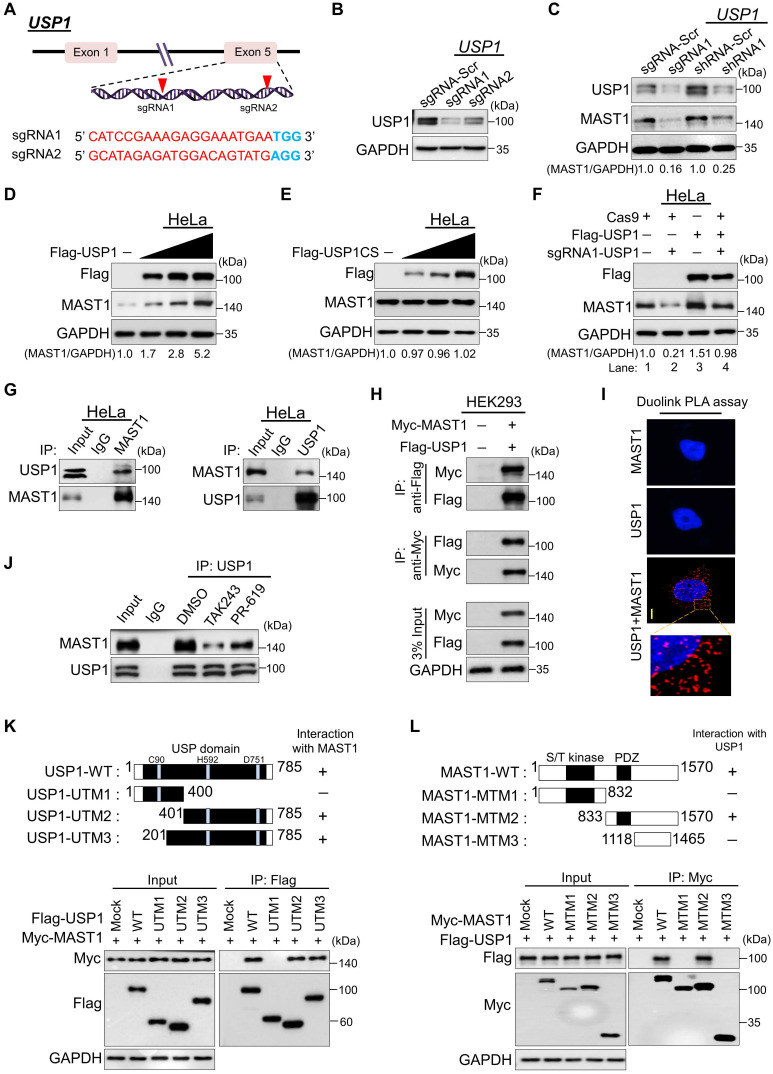
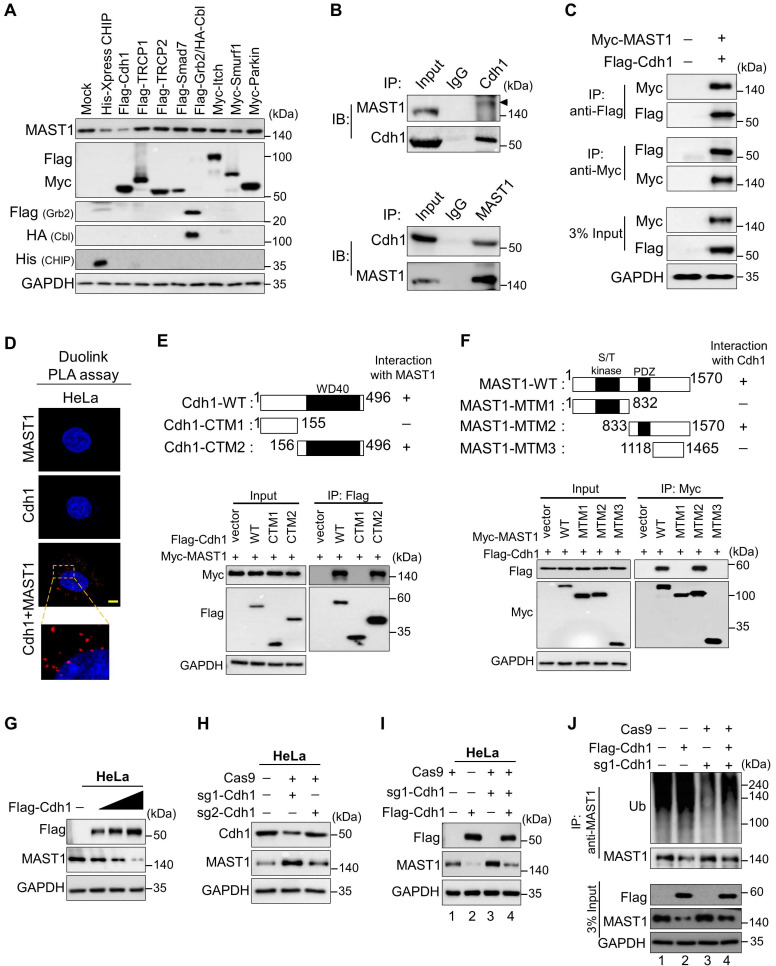
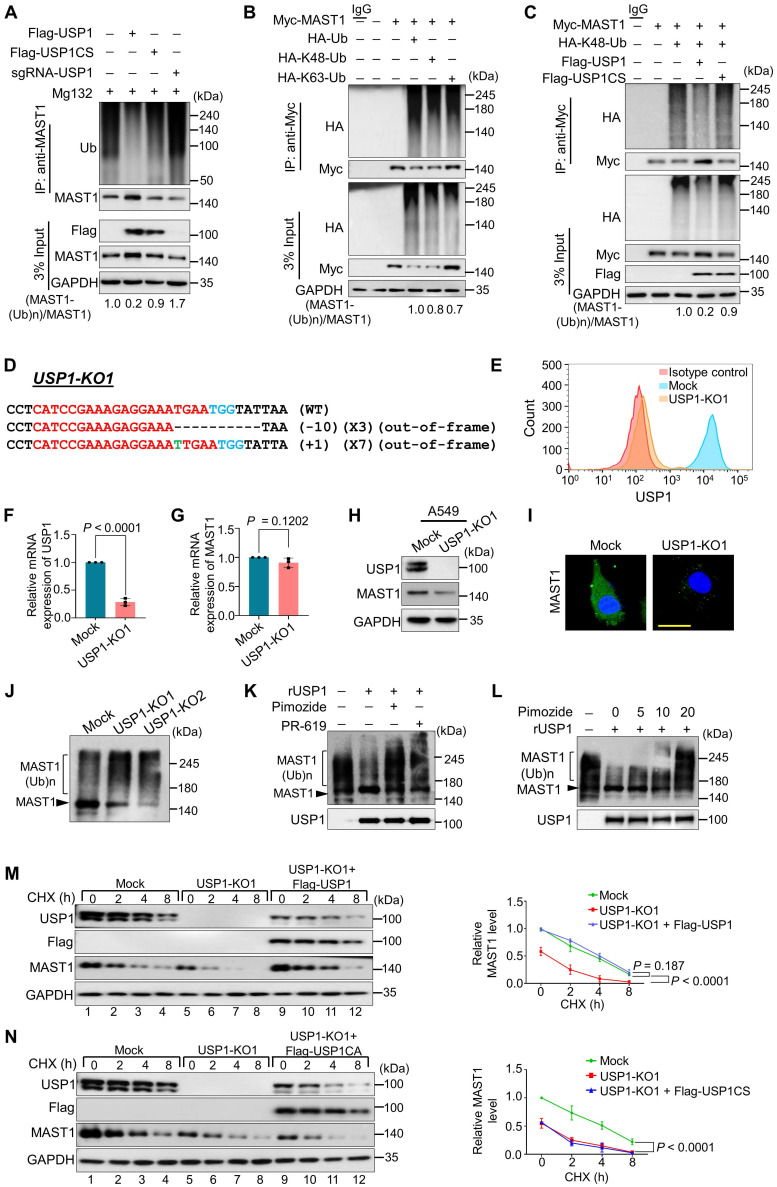
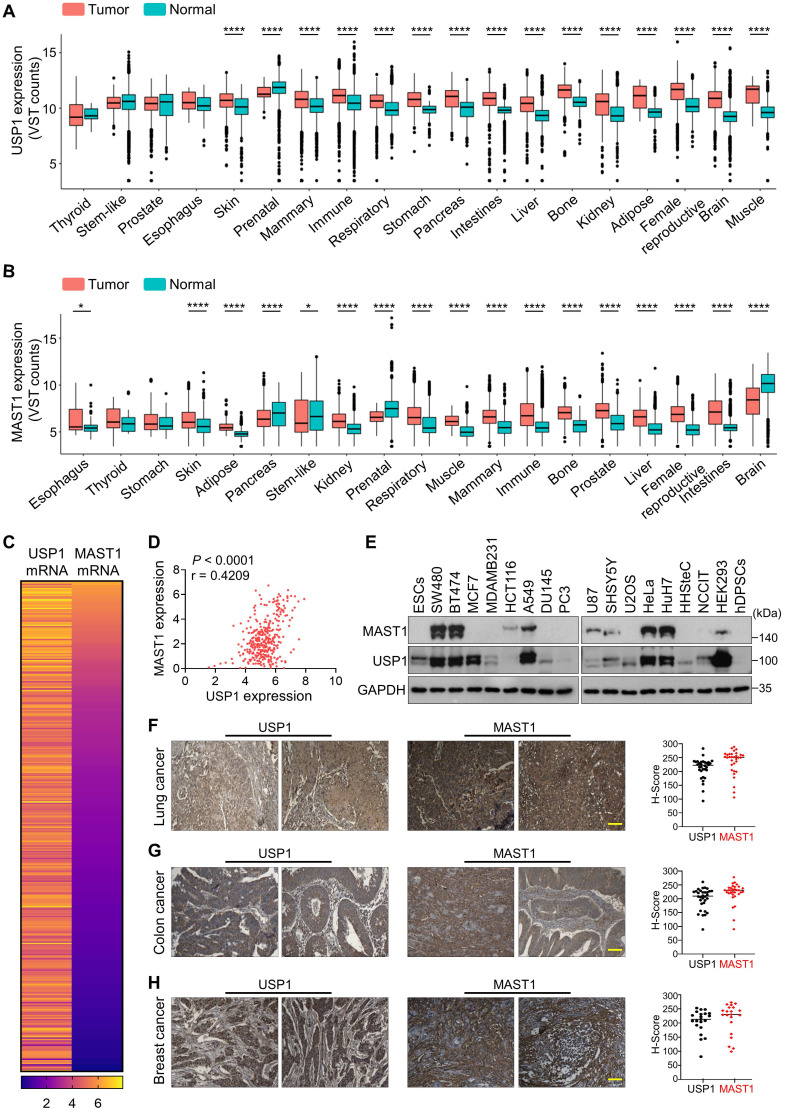
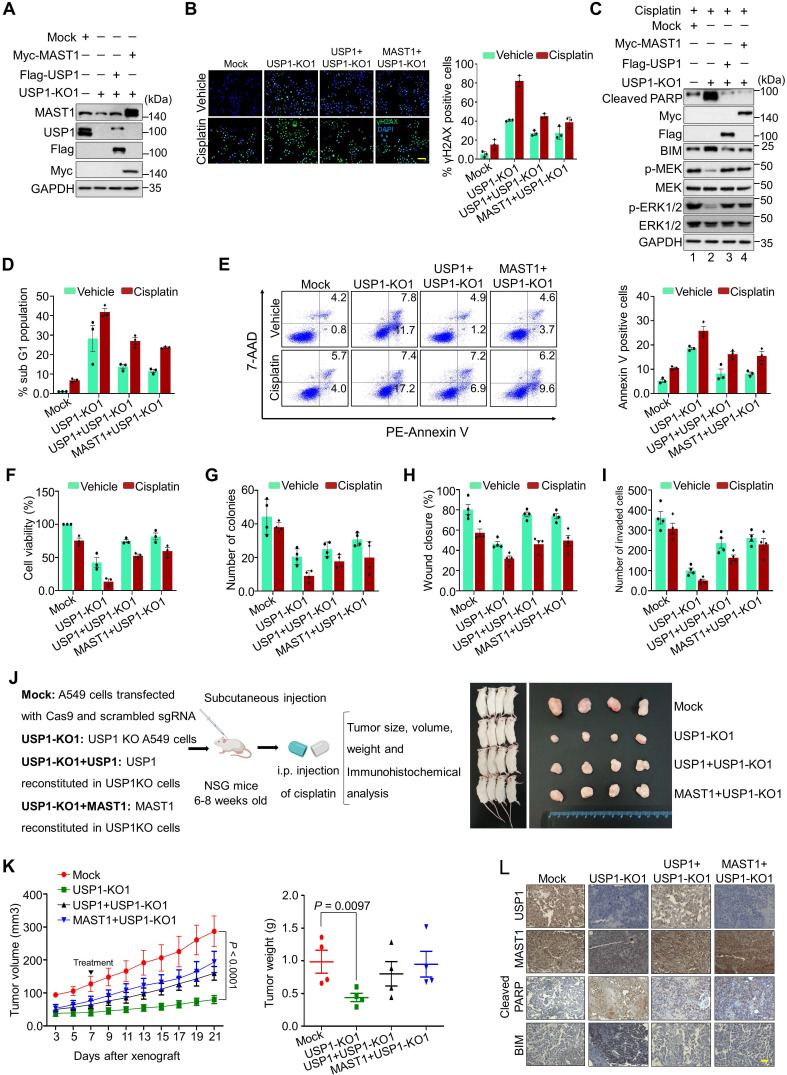
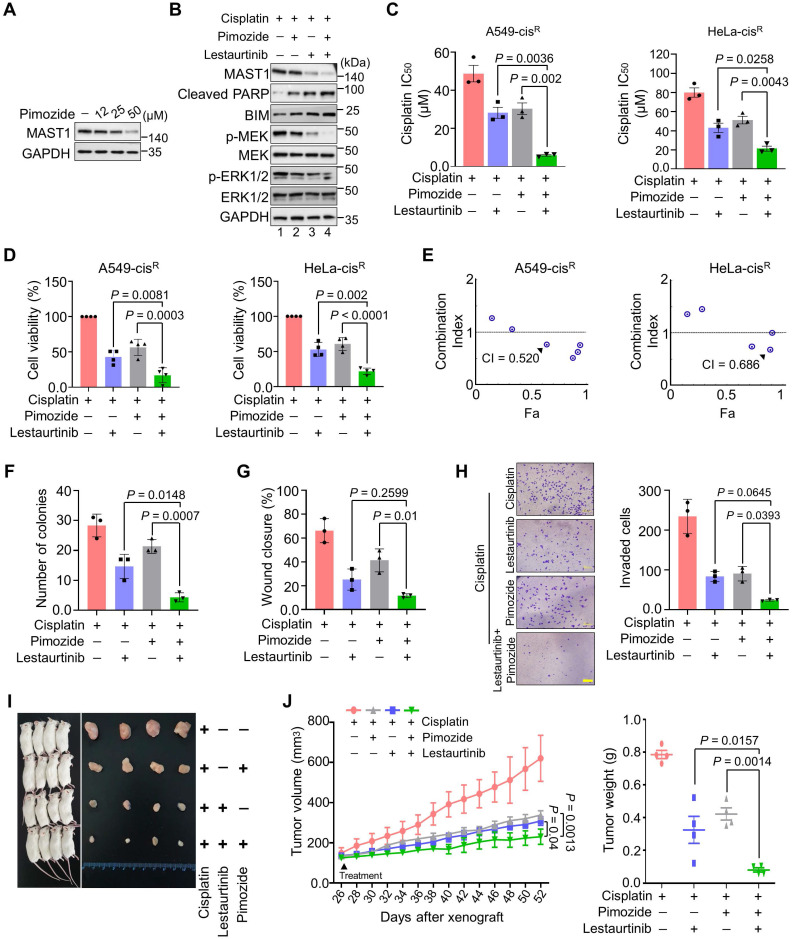
Background: Cisplatin is one of the frontline anticancer agents. However, development of cisplatin-resistance limits the therapeutic efficacy of cisplatin-based treatment. The expression of microtubule-associated serine/threonine kinase 1 (MAST1) is a primary factor driving cisplatin-resistance in cancers by rewiring the MEK pathway. However, the mechanisms responsible for MAST1 regulation in conferring drug resistance is unknown. Methods: We implemented a CRISPR/Cas9-based, genome-wide, dual screening system to identify deubiquitinating enzymes (DUBs) that govern cisplatin resistance and regulate MAST1 protein level. We analyzed K48- and K63-linked polyubiquitination of MAST1 protein and mapped the interacting domain between USP1 and MAST1 by immunoprecipitation assay. The deubiquitinating effect of USP1 on MAST1 protein was validated using rescue experiments, in vitro deubiquitination assay, immunoprecipitation assays, and half-life analysis. Furthermore, USP1-knockout A549 lung cancer cells were generated to validate the deubiquitinating activity of USP1 on MAST1 abundance. The USP1-MAST1 correlation was evaluated using bioinformatics tool and in different human clinical tissues. The potential role of USP1 in regulating MAST1-mediated cisplatin resistance was confirmed using a series of in vitro and in vivo experiments. Finally, the clinical relevance of the USP1-MAST1 axis was validated by application of small-molecule inhibitors in a lung cancer xenograft model in NSG mice. Results: The CRISPR/Cas9-based dual screening system identified USP1 as a novel deubiquitinase that interacts, stabilizes, and extends the half-life of MAST1 by preventing its K48-linked polyubiquitination. The expression analysis across human clinical tissues revealed a positive correlation between USP1 and MAST1. USP1 promotes MAST1-mediated MEK1 activation as an underlying mechanism that contributes to cisplatin-resistance in cancers. Loss of USP1 led to attenuation of MAST1-mediated cisplatin-resistance both in vitro and in vivo. The combined pharmacological inhibition of USP1 and MAST1 using small-molecule inhibitors further abrogated MAST1 level and synergistically enhanced cisplatin efficacy in a mouse xenograft model. Conclusions: Overall, our study highlights the role of USP1 in the development of cisplatin resistance and uncovers the regulatory mechanism of MAST1-mediated cisplatin resistance in cancers. Co-treatment with USP1 and MAST1 inhibitors abrogated tumor growth and synergistically enhanced cisplatin efficacy, suggesting a novel alternative combinatorial therapeutic strategy that could further improve MAST1-based therapy in patients with cisplatin-resistant tumors.

Keywords: Apoptosis; DNA damage; DUB inhibitor; clinical tumor samples; drug resistance; kinase inhibitor; ubiquitin proteasome system.


Conflict of interest statement

Competing Interests: The authors have declared that no competing interest exists.

Figures

Figure 1
Figure 1
CRISPR/Cas9-based genome-scale screening of USP subfamily proteins showing drug resistance to cisplatin treatment. (A) Schematic illustration of primary screening using CRISPR/Cas9-based DUB knockout screening system and cisplatin treatment. Step 1: In silico analysis to design sgRNAs targeting entire USP subfamily genes with high cleavage efficiency and low off-target scores. Steps 2-3: sgRNA synthesis and cloning into U6 promoter-driven plasmid followed by sequence analysis. Steps 4-5: The sgRNA library targeting an entire set of genes encoding USPs was co-transfected with Cas9 into HeLa-cisR cells and incubated for 24 h (day 1). Step 6: sgRNA-transfected cells were selected by puromycin (2 µg/mL) for 3 days (days 2-5). On day 9, the puromycin-selected HeLa-cisR cells were re-seeded into 96-well plates at a density of 10,000 cells/well. The cells were cultured in vehicle or a sub-lethal dose of cisplatin for 48 h (days 10-12). Step 7: Cells were subjected to the cell viability assay using a CCK-8 kit. (B) The cisplatin-induced cell death from (A) was estimated using a cell viability assay and plotted as a bar graph. Vehicle-treated HeLa-cisR cells served as the negative control, and cisplatin-treated HeLa-cisR cells co-transfected with scrambled sgRNA and Cas9 served as the mock control. Data are presented as the mean and standard deviation of three independent experiments (n = 3). One-way ANOVA followed by Tukey's post hoc test was used with the indicated P values. (C) Cell viability of the putative DUB candidates. Data are presented as the mean and standard deviation of three independent experiments (n = 3). One-way ANOVA followed by Tukey's post hoc test was used with the indicated P values. (D) The HeLa-cisR cells were transfected with sgRNAs targeting the putative candidates and then exposed to a sub-lethal dose of cisplatin to assess the cisplatin-induced DNA damage using γH2AX antibodies. H2AX and GAPDH were used as loading controls. The relative expression of γH2AX was quantified with ImageJ software (right panel). Data are presented as the mean and standard deviation of three independent experiments (n = 3). One-way ANOVA followed by Tukey's post hoc test was used with the indicated P values. (E) Immunofluorescence staining showing γH2AX expression in HeLa-cisR cells transfected with sgRNAs targeting the indicated DUB candidates and exposed to vehicle or cisplatin. γH2AX-positive cells were quantified, and the results are represented as a bar graph (right panel). Data are presented as the mean and standard deviation of three independent experiments (n = 3). One-way ANOVA followed by Tukey's post hoc test was used with the indicated P values. Scale bar = 100 µm.
Figure 2
Figure 2
DUB knockout library kit-based screening for USPs regulating MAST1 protein level by Western blot analysis. (A) Schematic representation of secondary screening with a CRISPR/Cas9-based sgRNA library to find DUBs that regulate MAST1 protein level. Steps 1-2: The designed DUB knockout sgRNA library, which consists of an entire set of genes encoding USPs, was co-transfected with Cas9 into HeLa-cisR cells (day 1). Step 3: The cells were placed under puromycin selection (2 µg/mL) and incubated for 3 days (days 2-5). Step 4: The transfected cells were harvested and lysed, and protein was isolated. Steps 5-6: Protein concentration was estimated by Bradford reagent, and equal concentrations of all DUBKO cell lysates were loaded on SDS-PAGE and screened for DUB candidates regulating endogenous expression pattern of MAST1 using Western blot (WB) analysis. (B) Equal protein concentrations from the cell lysates from (A) were subjected to Western blotting to determine the endogenous MAST1 protein level. For each blot, HeLa-cisR cells co-transfected with scrambled sgRNA and Cas9 served as the mock control. GAPDH was used as a loading control. The protein band intensities were estimated using ImageJ software with reference to the GAPDH control for each individual sgRNA (MAST1/GAPDH) and presented below the blot. (C) The effects of the targeting the putative DUB candidates on the MAST1 protein level were estimated by Western blotting. The protein band intensities were estimated using ImageJ software with reference to the GAPDH control band for each individual sgRNA (MAST1/GAPDH) ) and presented below the blot. (D) The interactions between putative DUB candidates and MAST1 by co-immunoprecipitation analysis. Myc-MAST1 and DUBs (Flag-USP1, Flag-USP28, and Flag-USP44) were transfected into HEK293 cells. (E) The interaction between endogenous USP9X and MAST1 by co-immunoprecipitation analysis. Cell lysates were immunoprecipitated and immunoblotted with the indicated antibodies. (F) A Venn diagram showing the overlapping DUB candidate based on cisplatin cytotoxicity, loss-of-function effect on MAST1 protein level, and interaction analysis with MAST1.
Figure 3
Figure 3
USP1 interacts with and regulates the MAST1 protein. (A) Schematic representation of the sgRNAs targeting exon 5 of the USP1 gene. Red arrowheads indicate the positions of sgRNAs that target the top strand. sgRNA sequences are in red; PAM sequences are in bold blue font. (B) Validation of sgRNA efficiency targeting USP1 by transient transfection of sgRNA1 and sgRNA2 into HeLa cells and immunoblotting with USP1 antibody. (C) HeLa cells were transfected with sgRNA1 and shRNA1 targeting USP1, and the endogenous protein levels of USP1 and MAST1 were checked by Western blotting. (D) HeLa cells were transfected with increasing concentrations of Flag-USP1 to check the endogenous MAST1 protein level. (E) HeLa cells were transfected with increasing concentrations of Flag-USP1CS to assess the endogenous MAST1 protein level. (F) The reconstitution effect of Flag-USP1 on endogenous MAST1 protein in USP1-depleted HeLa cells. The protein band intensities (Fig 3C-F) were estimated using ImageJ software with reference to the GAPDH control band for each individual sgRNA (MAST1/GAPDH) and presented below the blot. (G) Interactions between endogenous and (H) exogenous USP1 and MAST1 proteins were analyzed in HeLa cells and HEK293 cells, respectively. Cell lysates were immunoprecipitated and immunoblotted with the indicated antibodies. Protein expression was checked using Western blotting. GAPDH was used as a loading control. (I) HeLa cells were subjected to the Duolink PLA assay to analyze the interaction between USP1 and MAST1 using specific antibodies. In situ USP1-MAST1 interaction (PLA dots) was observed when USP1 and MAST1 were immunostained together but not when they were stained with individual antibodies. Scale bar: 10 µm. (J) HeLa cells were treated with either MLN7243 (10 µM) or PR-619 (20 µM) for 1 h before harvesting. Cell lysates were immunoprecipitated and immunoblotted with the indicated antibodies. (K) Schematic representation of full length USP1 (1-785 aa) encoding USP domain with catalytic triad residues (Cys, His, and Asp box) (represented as USP1-WT), N-terminus USP1 (1-400 aa) encoding catalytic Cys box (represented as USP1-UTM1), C-terminus USP1 (401-785 aa) encoding catalytic His and Asp box (represented as USP1-UTM2), and extended C-terminus USP1 (201-785 aa) encoding catalytic His and Asp box (represented as USP1-UTM3). Interactions between full length MAST1 and USP1 truncated mutants by co-immunoprecipitation and immunoblotting with the indicated antibodies (lower panel). (L) Schematic representation of full length MAST1 (1-1570 aa) encoding serine/threonine (S/T) kinase domain and PDZ domain (represented as MAST1-WT), N-terminus MAST1 (1-832 aa) encoding S/T kinase domain (represented as MAST1-MTM1), C-terminus MAST1 (833-1570 aa) encoding PDZ domain (represented as MAST1-MTM2), and C-terminus MAST1 (1118-1465 aa) lacking PDZ domain (represented as MAST1-MTM3). Interactions between full length USP1 and MAST1 truncated mutants were analyzed by co-immunoprecipitation and immunoblotting with the indicated antibodies (lower panel).
Figure 4
Figure 4
The E3 ligase Cdh1 interacts with and downregulates MAST1 protein. (A) HeLa cells were transfected with a panel of E3 ligases, and the expression of MAST1 protein was analyzed using Western blotting. (B) Interactions between endogenous and (C) exogenous Cdh1 and MAST1 proteins were analyzed in HeLa cells and HEK293 cells, respectively. Cell lysates were immunoprecipitated and immunoblotted with the indicated antibodies. Protein expression was checked using Western blotting. GAPDH was used as a loading control. (D) HeLa cells were subjected to the Duolink PLA assay to analyze the interaction between Cdh1 and MAST1 using specific antibodies. Scale bar: 10 µm. (E) Schematic representation of full length Cdh1 (1-496 aa) encoding WD40 domain (represented as Cdh1-WT), N-terminus Cdh1 (1-155 aa) lacking WD40 domain (represented as Cdh1-CTM1), and C-terminus Cdh1 (156-496 aa) encoding WD40 domain (represented as Cdh1-CTM2). Interactions between full length MAST1 and Cdh1 truncated mutants by co-immunoprecipitation and immunoblotting with the indicated antibodies (lower panel). (F) Schematic representation of full length MAST1 (1-1570 aa) encoding serine/threonine (S/T) kinase domain and PDZ domain (represented as MAST1-WT), N-terminus MAST1 (1-832 aa) encoding S/T kinase domain (represented as MAST1-MTM1), C-terminus MAST1 (833-1570 aa) encoding PDZ domain (represented as MAST1-MTM2), and C-terminus MAST1 (1118-1465 aa) lacking PDZ domain (represented as MAST1-MTM3). Interactions between full length Cdh1 and MAST1 truncated mutants by co-immunoprecipitation and immunoblotting with the indicated antibodies (lower panel). (G) The effect of Cdh1 on endogenous MAST1 protein was analyzed in HeLa cells transfected with increasing concentrations of Flag-Cdh1. (H) HeLa cells were transfected with sgRNA1 and sgRNA2 targeting Cdh1 to assess the endogenous protein levels of Cdh1 and MAST1 by Western blotting. (I) The Cdh1-mediated degradation of endogenous MAST1 protein was rescued in cells transfected with sgRNA targeting Cdh1. (J) The ubiquitination of endogenous MAST1 was analyzed by transfecting HeLa cells with Flag-Cdh1 or sgRNA targeting Cdh1 followed by immunoprecipitation with an anti-MAST1 antibody and immunoblotting with an anti-ubiquitin antibody. Protein expression was checked by Western blotting with the indicated antibodies. GAPDH was used as a loading control.
Figure 5
Figure 5
USP1 extends MAST1 protein half-life by its deubiquitinating activity. (A) The ubiquitination and deubiquitination of endogenous MAST1 were analyzed by transfecting HeLa cells with Flag-USP1, Flag-USP1CS, or sgRNA targeting USP1 followed by immunoprecipitation with an anti-MAST1 antibody and immunoblotting with an anti-ubiquitin antibody. The cells were treated with MG132 for 6 h prior to harvest. (B) The K48- and K63-linked polyubiquitination of MAST1 was analyzed by transfecting HEK293 cells with Myc-MAST1, HA-ubiquitin, HA-K48-ubiquitin, and HA-K63-ubiquitin, followed by immunoprecipitation with an anti-Myc antibody and immunoblotting with anti-HA and anti-Myc antibodies. (C) The deubiquitination of K48-linked ubiquitination of MAST1 by USP1 was analyzed by transfecting HEK293 cells with Myc-MAST1 and HA-K48-ubiquitin along with Flag-USP1 or Flag-USP1CS, followed by immunoprecipitation with an anti-Myc antibody and immunoblotting with anti-HA and anti-Myc antibodies. The relative protein expression of MAST1-(Ub)n with respect to input MAST1 for (A-C) was quantified using ImageJ software and represented as (MAST1-(Ub)n/MAST1) below the blot. (D) Sanger sequencing data showing the disrupted USP1 gene sequences in A549 cells (USP1-KO1). The sgRNA recognition site is denoted in red. The deleted bases are indicated with dashes, and the inserted bases are denoted with green, with the number of deleted or inserted bases indicated in parentheses. The number of occurrences of the indicated sequence is shown in parentheses (for example, X3 and X7 indicate the number of each clone sequenced). (E) Flow cytometry assay showing the expression of USP1 in mock control vs. USP1-KO1. (F) The effect of USP1-KO1 on the mRNA expression of USP1 and (G) MAST1 was analyzed by qRT-PCR with specific primers. The relative mRNA expression levels are shown after normalization to GAPDH mRNA expression. Data are presented as the mean and standard deviation of three independent experiments (n = 3). A two-tailed t-test was used, and the P values are indicated. (H) Western blot analysis of the endogenous expression of USP1 and MAST1 protein in USP1-KO1. GAPDH was used as the internal loading control. (I) The effect of USP1 gene disruption on the endogenous expression of MAST1 was analyzed by immunofluorescence staining. Scale bar: 10 µm. (J) The TUBEs assay was performed to assess the ubiquitination status of the MAST1 protein in mock control and USP1-KO1 and USP1-KO2 clones. Cell lysates were immunoprecipitated with TUBEs antibodies, followed by immunoblotting with the indicated antibodies. (K) The total polyubiquitinated MAST1 protein was pulled down using TUBE2 resin from USP1-KO1 A549 cells treated with or without rUSP1 protein in the presence or absence of PR-619 (100 µM) and pimozide (20 µM) at 37 °C for 1 h. The eluted samples were analyzed by Western blotting with indicated antibodies. (L) The polyubiquitinated MAST1 protein was pulled down using TUBE2 resin treated with or without rUSP1 protein in the presence or absence of increasing concentrations of pimozide (0, 5, 10, and 20 µM) at 37 °C for 1 h. The eluted samples were analyzed by Western blotting with indicated antibodies. (M) Mock control, USP1-KO1, and USP1-KO1 reconstituted with either Flag-USP1 or (N) Flag-USP1CS were used to analyze the half-life of MAST1. CHX (150 µg/mL) was administered for the indicated time, and the cells were then harvested for Western blotting with the indicated antibodies, GAPDH was used as a loading control. Data are presented as the mean and standard deviation of three independent experiments (n=3). Two-way ANOVA followed by Tukey's post hoc test was used with the indicated P values.
Figure 6
Figure 6
Clinical correlation between USP1 and MAST1 expression in various cancer tissues. (A) Box plot showing the difference between USP1 expression in tumor and normal tissues using Correlation AnalyzeR. Significance was determined via the Wilcoxon rank sum test: ****P < 0.0001. (B) Box plot showing the difference between MAST1 expression in tumor and normal tissues using Correlation AnalyzeR. Significance was determined via the Wilcoxon rank sum test: *P < .05, ****P < 0.0001. VST stands for variance-stabilizing transform. (C) A heat map showing mRNA expression levels of USP1 and MAST1 derived from the CCLE database. Representative samples are arranged from high to low mRNA levels of MAST1, and corresponding USP1 values are sorted. (D) A scatterplot showing the expression correlation between USP1 and MAST1 mRNA levels. Pearson correlations (r) quantifying the relationship between USP1 and MAST1 are given. (E) Endogenous protein expression patterns of USP1 and MAST1 in different cancer and non-cancer cell lines were assessed by Western blotting. GAPDH was used as the loading control. (F-H) Representative immunohistochemical (IHC) staining images of endogenous USP1 and MAST1 in (F) human lung cancer (n = 32), (G) colon cancer (n = 32), and (H) breast cancer (n = 21) tissues. All IHC images were quantified with an H-score. Scale bar = 30 µm.
Figure 7
Figure 7
Depletion of USP1 promotes apoptosis, DNA damage, and tumor growth arrest. Mock control, USP1-KO1, and USP1-KO1 cells reconstituted with either USP1 or MAST1 were used to perform the following experiments. (A) Western blot analyses to validate the expression of USP1 and MAST1 using USP1- and MAST1-specific antibodies. GAPDH was used as the loading control. (B) The cells were treated with either vehicle or cisplatin (2 µg/mL) for 24 h and subjected to immunofluorescence analysis to estimate γH2AX foci formation. Green, γH2AX; blue, nucleus stained by DAPI. Scale bar = 100 µm. The right panel depicts the percentage of γH2AX-positive cells. (C) The cells were treated with cisplatin (2 µg/mL) for 24 h, and MEK1 activation and apoptosis-related factors were determined using Western blotting. GAPDH was used as the internal loading control. (D) The cells were treated with either vehicle or cisplatin (2 µg/mL) for 48 h and subjected to flow cytometry to measure the DNA content using PI staining and (E) annexin-V and 7-AAD staining. (F) The cells were treated with a sub-lethal dose of cisplatin (2 µg/mL) for 48 h, and cell viability was assayed using CCK-8 reagent. Data are presented as the mean and standard deviation of three independent experiments (n = 3). (G-I) Vehicle- or cisplatin-treated cells were subjected to a (G) colony formation assay, (H) wound-healing assay, and (I) Transwell cell-invasion assay. Data are presented as the mean and standard deviation of four independent experiments (n = 4). (J) Xenografts were generated by subcutaneously injecting the mentioned cell groups into the right flanks of NSG mice (n = 4/group). Mice were i.p. injected with either saline (vehicle) or cisplatin (2 mg/kg) twice a week beginning 7 days after xenograft implantation, and tumor size was monitored. Tumor volumes were recorded, and tissues were stored for IHC experiments. The right panel shows the tumors excised from the mice after the experiment. (K) Tumor volume was measured every other day and is presented graphically. Data are presented as the mean and standard deviation of four independent experiments (n = 4). Two-way ANOVA followed by Tukey's post hoc test was used with the indicated P values. (L) Xenograft tumors were embedded in paraffin and sectioned. IHC analyses were performed with the indicated antibodies. Scale bar = 30 µm.
Figure 8
Figure 8
Combination of pimozide and lestaurtinib inhibits MAST1 protein and cisplatin-resistant tumor growth more than either single treatment. (A) The effect of USP1 inhibition on MAST1 protein level was determined by treating HeLa-cisR cells with increasing concentrations of pimozide for 24 h. The protein expression of MAST1 was determined by Western blotting. GAPDH was used as an internal loading control. (B) The effect of combination treatment of pimozide and lestaurtinib on MAST1-mediated MEK phosphorylation. HeLa-cisR cells were treated with pimozide (50 µM) and lestaurtinib (200 nM) in the presence of sub-lethal doses of cisplatin (5 µg/mL) for 24 h. The activity of MAST1 was assessed by a Western blot analysis of the phospho-MEK1 and phospho-ERK levels. GAPDH was used as an internal loading control. (C, D) The effect of combined treatment with pimozide and lestaurtinib on (C) cisplatin sensitivity (n = 3) (D) and cell viability in A549-cisR and HeLa-cisR cells (n = 4). Data are presented as the mean and standard deviation of at least three independent experiments. Two-way ANOVA followed by Tukey's post hoc test was used with the indicated P values. (E) Combination index (CI) plots for the synergistic effect of pimozide and lestaurtinib in A549-cisR and HeLa-cisR cells. (F-H) The effect of combination treatment with pimozide and lestaurtinib was validated using (F) colony formation assay, (G) wound-healing assay, and (H) Transwell cell-invasion assay. Data are presented as the mean and standard deviation of three independent experiments (n = 3). Two-way ANOVA followed by Tukey's post hoc test was used with the indicated P values. (I) Xenografts were generated by subcutaneously injecting A549-cisR cells into the right flanks of NSG mice (n = 4). Mice were treated with pimozide (10 mg/kg), lestaurtinib (20 mg/kg), and cisplatin (5 mg/kg) beginning 26 days after xenograft implantation, and tumor size was monitored. The right panel shows the tumors excised from the mice after the experiment. (J) Tumor volume and tumor weight were measured and are presented graphically. Data are presented as the mean and standard deviation of four independent experiments (n = 4). Two-way ANOVA followed by Tukey's post hoc test was used with the indicated P values. For brevity, statistical significance is shown only for comparisons between the groups of interest, except for the negative control group.

References

    1. Galanski M. Recent developments in the field of anticancer platinum complexes. Recent patents on anti-cancer drug discovery. 2006;1:285–95. - PubMed
    1. Kang X, Xiao HH, Song HQ, Jing XB, Yan LS, Qi RG. Advances in drug delivery system for platinum agents based combination therapy. Cancer biology & medicine. 2015;12:362–74. - PMC - PubMed
    1. Siddik ZH. Cisplatin: mode of cytotoxic action and molecular basis of resistance. Oncogene. 2003;22:7265–79. - PubMed
    1. Galluzzi L, Senovilla L, Vitale I, Michels J, Martins I, Kepp O. et al. Molecular mechanisms of cisplatin resistance. Oncogene. 2012;31:1869–83. - PubMed
    1. Wang J, Zhou JY, Wu GS. ERK-dependent MKP-1-mediated cisplatin resistance in human ovarian cancer cells. Cancer research. 2007;67:11933–41. - PubMed

Publication types