. 2022 Jul 18;12(13):5645-5674.
doi: 10.7150/thno.63177. eCollection 2022.

Therapeutic aptamer targeting sclerostin loop3 for promoting bone formation without increasing cardiovascular risk in osteogenesis imperfecta mice

Affiliations

Therapeutic aptamer targeting sclerostin loop3 for promoting bone formation without increasing cardiovascular risk in osteogenesis imperfecta mice

Luyao Wang et al. Theranostics. .

Abstract

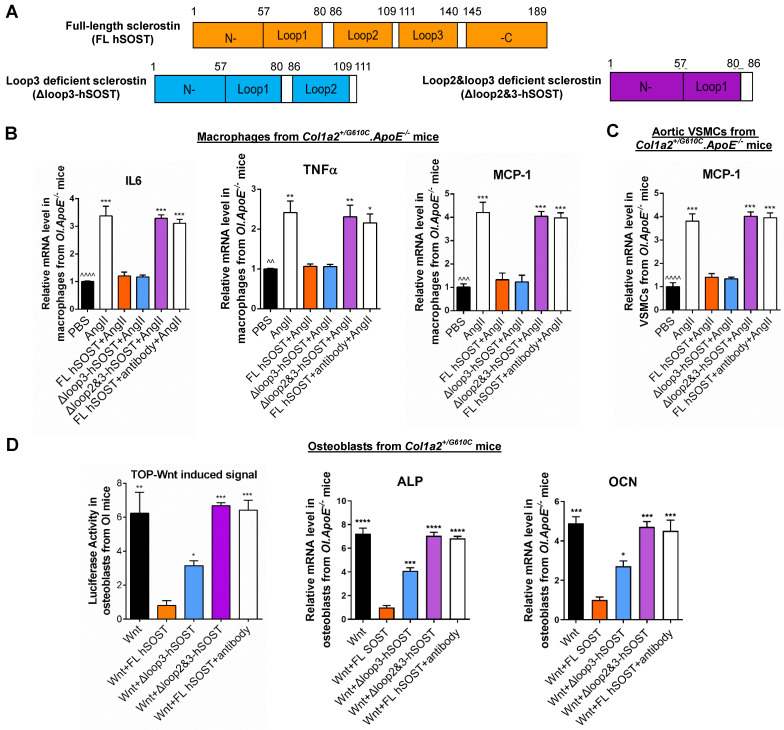
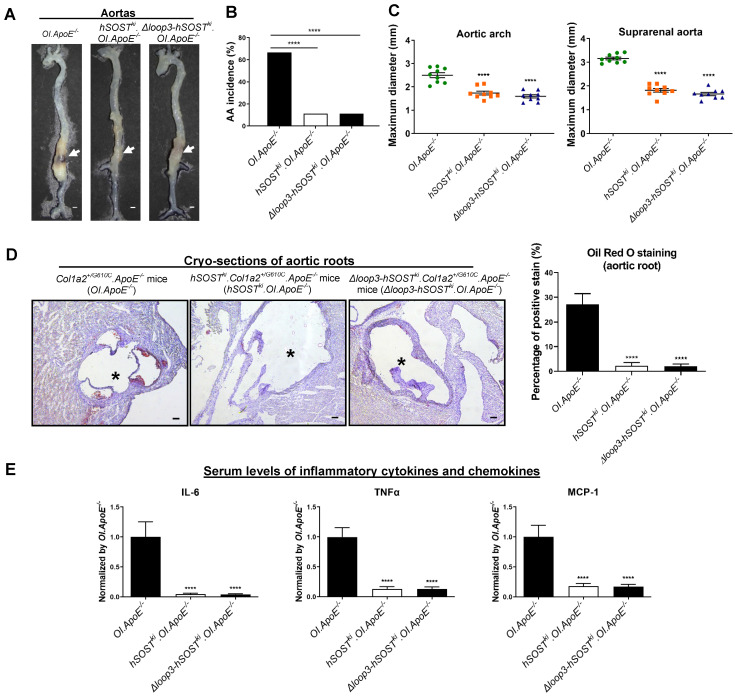
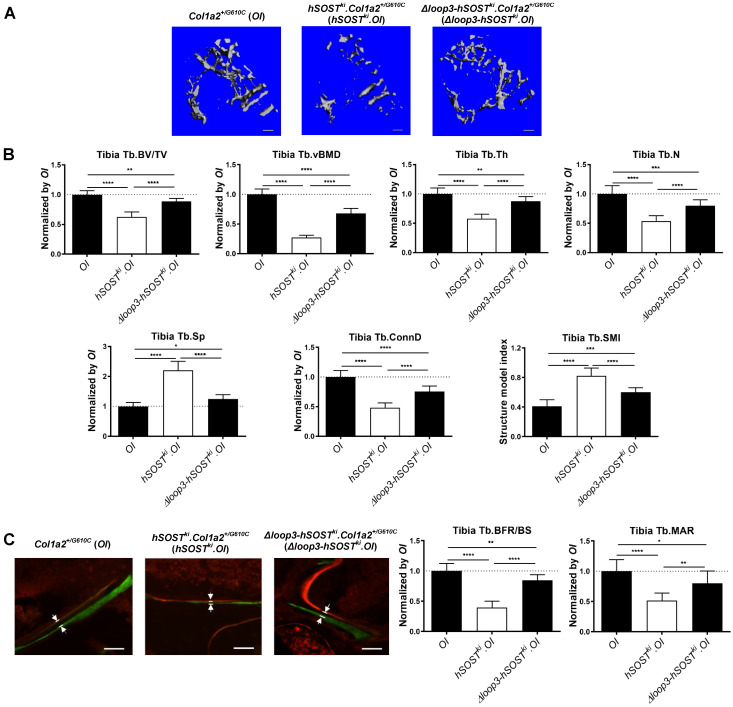
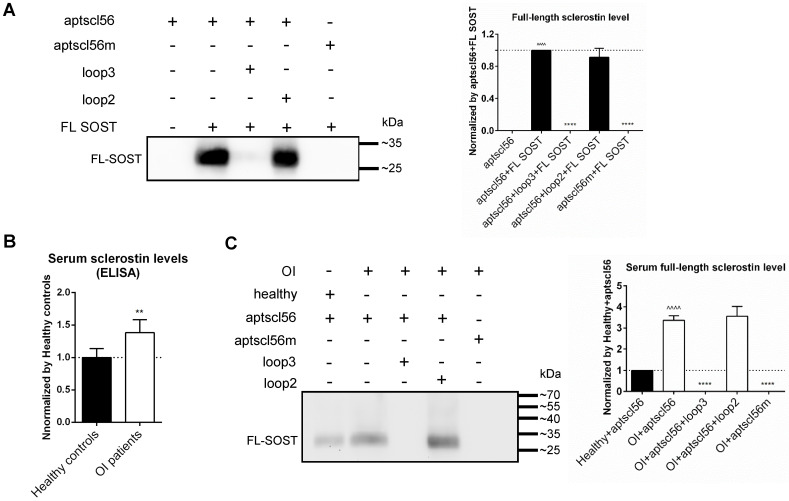
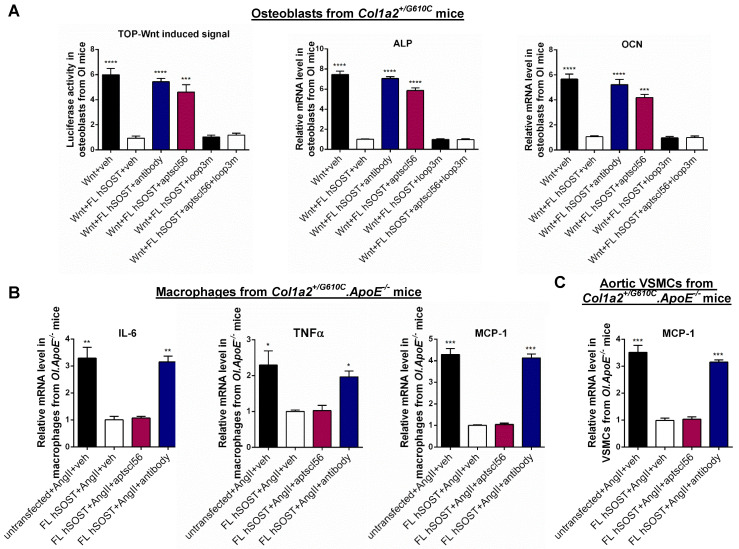
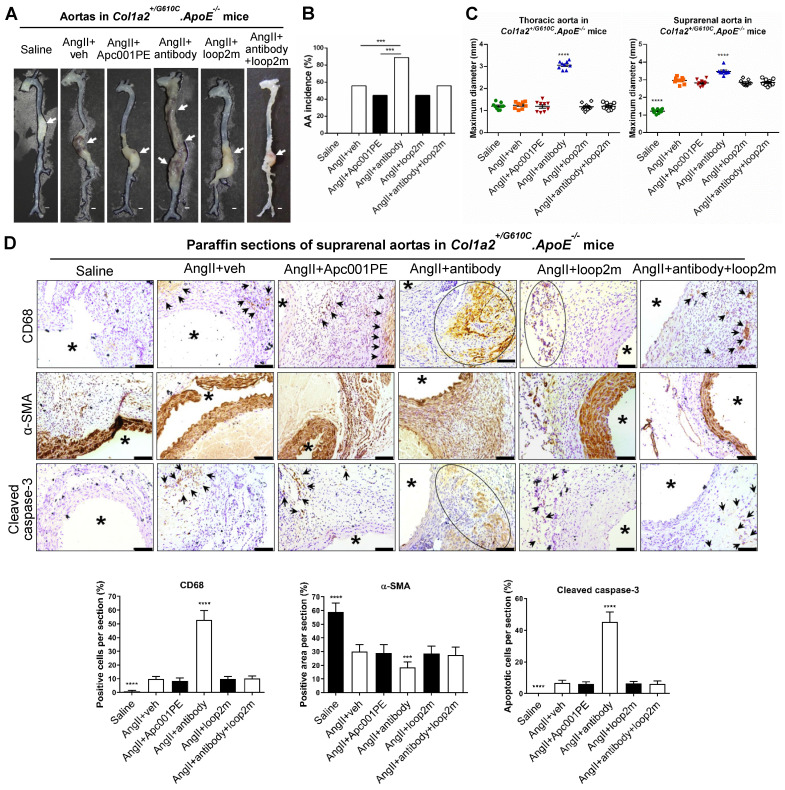
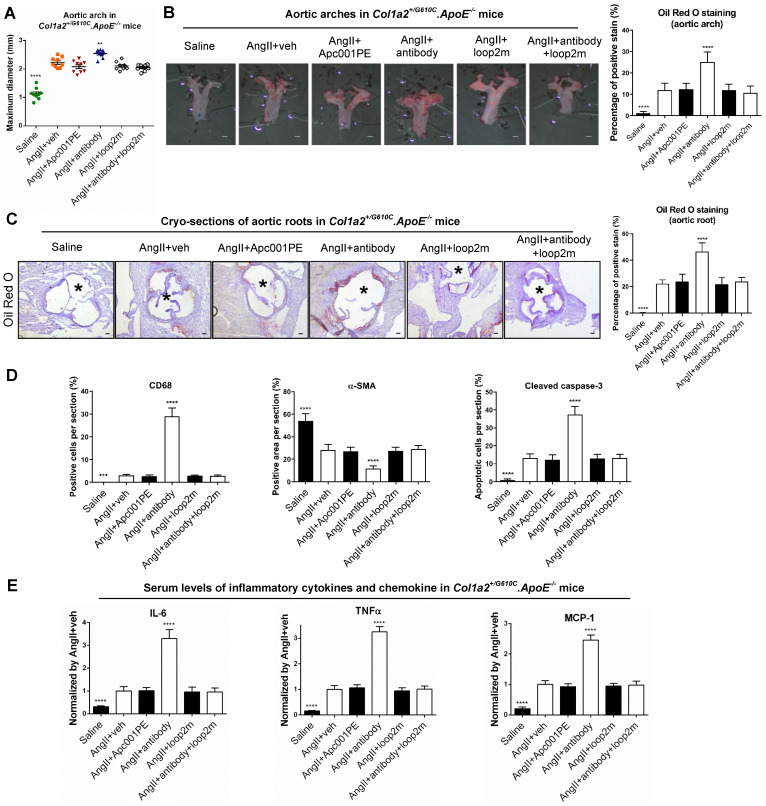
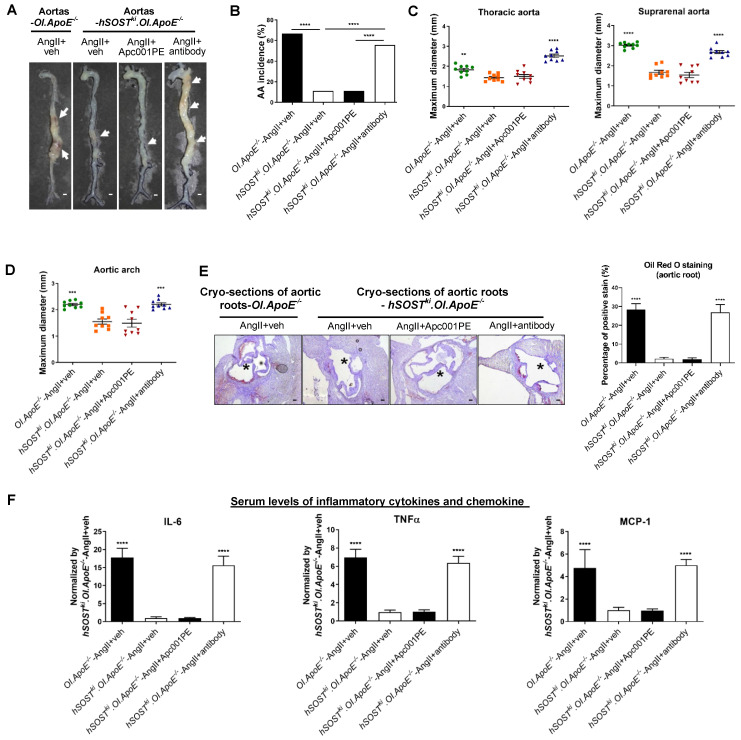
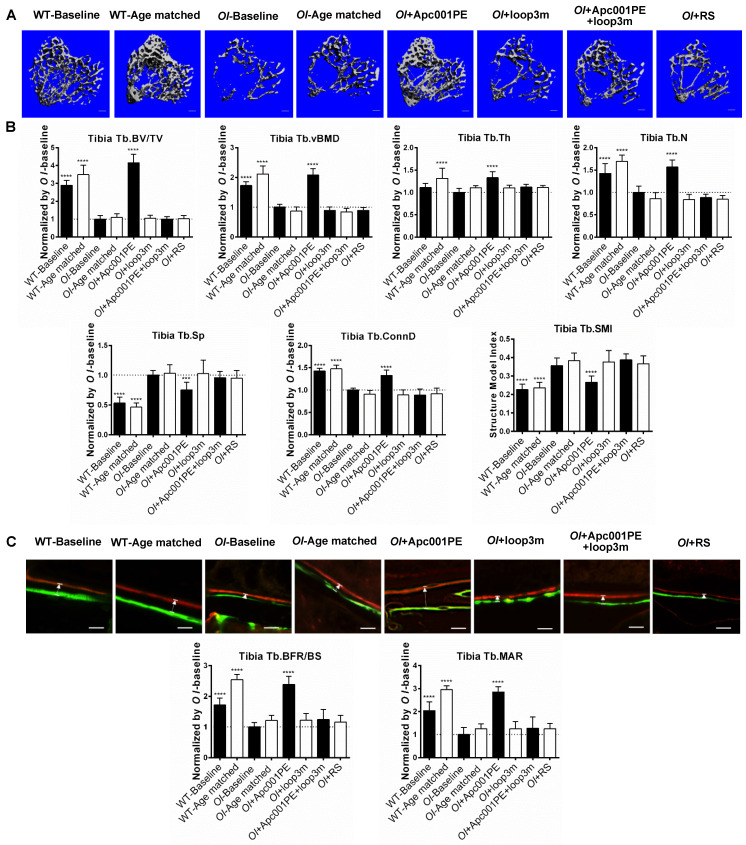
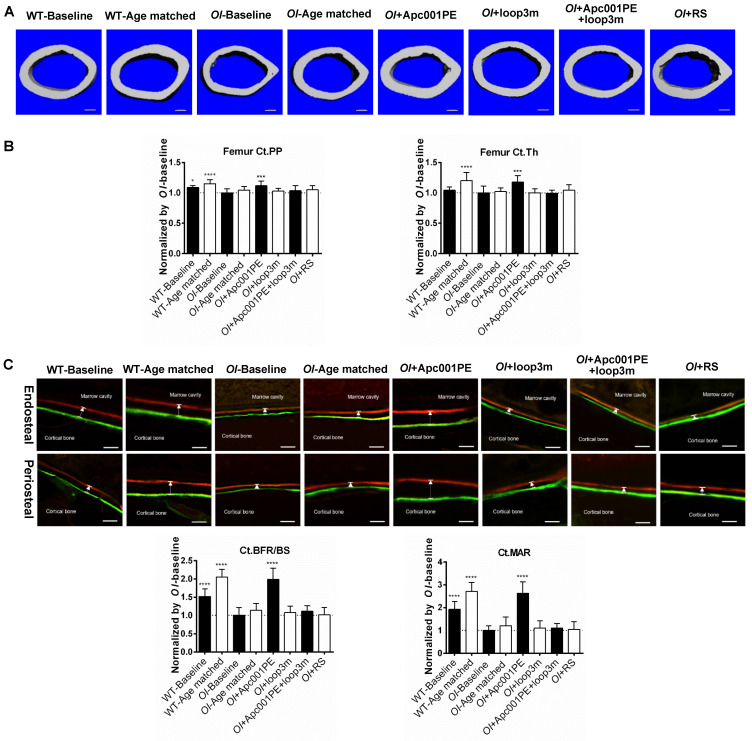
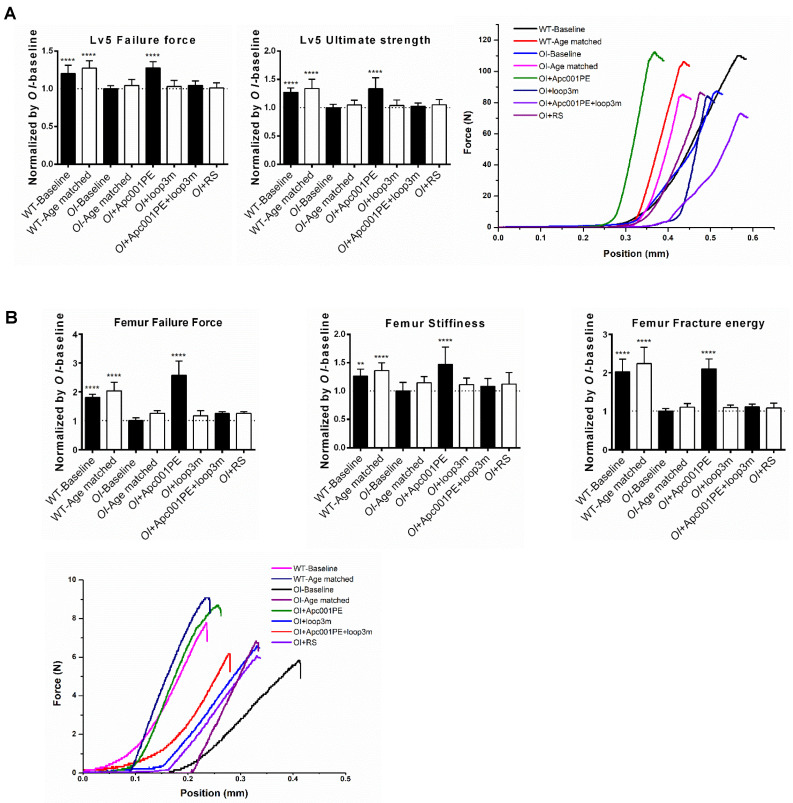
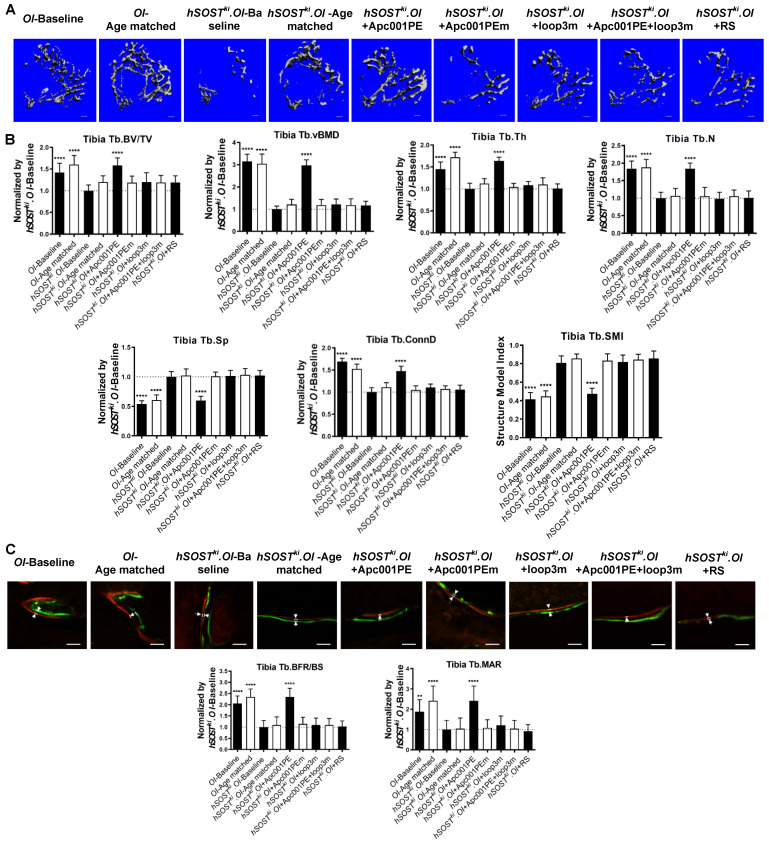
Rationale: Sclerostin inhibition demonstrated bone anabolic potential in osteogenesis imperfecta (OI) mice, whereas humanized therapeutic sclerostin antibody romosozumab for postmenopausal osteoporosis imposed clinically severe cardiac ischemic events. Therefore, it is desirable to develop the next generation sclerostin inhibitors to promote bone formation without increasing cardiovascular risk for OI. Methods and Results: Our data showed that sclerostin suppressed inflammatory responses, prevented aortic aneurysm (AA) and atherosclerosis progression in hSOSTki.Col1a2+/G610C.ApoE-/- mice. Either loop2&3 deficiency or inhibition attenuated sclerostin's suppressive effects on expression of inflammatory cytokines and chemokines in vitro, whilst loop3 deficiency maintained the protective effect of sclerostin on cardiovascular system both in vitro and in vivo. Moreover, loop3 was critical for sclerostin's antagonistic effect on bone formation in Col1a2+/G610C mice. Accordingly, a sclerostin loop3-specific aptamer aptscl56 was identified by our lab. It could recognize both recombinant sclerostin and sclerostin in the serum of OI patients via targeting loop3. PEG40k conjugated aptscl56 (Apc001PE) demonstrated to promote bone formation, increase bone mass and improve bone microarchitecture integrity in Col1a2+/G610C mice via targeting loop3, while did not show influence in inflammatory response, AA and atherosclerosis progression in Col1a2+/G610C.ApoE-/- mice with Angiotensin II infusion. Further, Apc001PE had no influence in the protective effect of sclerostin on cardiovascular system in hSOSTki.Col1a2+/G610C.ApoE-/- mice, while it inhibited the antagonistic effect of sclerostin on bone formation in hSOSTki.Col1a2+/G610C mice via targeting loop3. Apc001PE was non-toxic to healthy rodents, even at ultrahigh dose. Apc001PE for OI was granted orphan drug designation by US-FDA in 2019 (DRU-2019-6966). Conclusion: Sclerostin loop3-specific aptamer Apc001PE promoted bone formation without increasing cardiovascular risk in OI mice.

Keywords: Aptamer; bone formation; no cardiovascular risk; no toxicity; osteogenesis imperfecta; sclerostin loop3.


Conflict of interest statement

Competing Interests: The authors have declared that no competing interest exists.

Figures

Figure 1
Figure 1
The role of sclerostin and its loops in regulating the expression of inflammatory cytokines and chemokines in macrophages and VSMCs from Col1a2+/G610C.ApoE-/- mice, Wnt signaling pathway and osteogenic potential in osteoblasts from Col1a2+/G610C mice in vitro. (A) Schematic diagram of primary structures of full-length human sclerostin and sclerostin truncations. (B) The effect of full-length human sclerostin (FL hSOST), human sclerostin with loop3 deficiency by genetic truncation (Δloop3-hSOST), human sclerostin with loop2&3 deficiency by genetic truncation (Δloop2&3-hSOST), and human sclerostin with loop2&3 inhibition by sclerostin antibody (FL hSOST+antibody), respectively, on regulating mRNA expression levels of inflammatory cytokines and chemokines in primary macrophages from Col1a2+/G610C.ApoE-/- mice with Ang II treatment in vitro. (C) The effect of FL hSOST, Δloop3-hSOST, Δloop2&3-hSOST, and FL hSOST+antibody, respectively, on regulating mRNA expression of inflammatory chemokine in aortic VSMCs from Col1a2+/G610C.ApoE-/- mice with Ang II treatment in vitro. (B-C) Data were expressed as mean ± standard deviation. ^^P < 0.01, ^^^P < 0.005 and ^^^^P < 0.0001 for a comparison of PBS with AngII group by a parried t-test. * P < 0.05, ** P < 0.01, *** P < 0.005 and **** P < 0.0001 for a comparison of AngII, Δloop3-hSOST+AngII, Δloop2&3-hSOST+AngII, and FL hSOST+antibody+AngII with FL hSOST +AngII by one-way ANOVA with Tukey's post-hoc test. (D) The effect of FL hSOST, Δloop3-hSOST, Δloop2&3-hSOST, and FL hSOST+antibody, respectively, on regulating Wnt signaling and osteogenic potential in osteoblasts from Col1a2+/G610C mice. One-way ANOVA with Tukey's post-hoc test vs. Wnt+FL hSOST group was used to determine the inter-group differences. * P < 0.05; ** P < 0.01; *** P < 0.005; **** P < 0.0001. Note: AngII: Angiotensin II; IL-6: interleukin 6; TNF-α: tumor necrosis factor alpha; MCP-1: monocyte chemoattractant protein-1; ALP: alkaline phosphatase; OCN: osteocalcin.
Figure 2
Figure 2
Loop3 deficient sclerostin maintained the protective effect of sclerostin on cardiovascular system of Col1a2+/G610C.ApoE-/- mice in vivo. (A) Representative images of aortas from Col1a2+/G610C.ApoE-/- mice (OI.ApoE-/-), hSOSTki.Col1a2+/G610C.ApoE-/- mice (hSOSTki.OI.ApoE-/-), and Δloop3-hSOSTki.Col1a2+/G610C.ApoE-/- mice (Δloop3-hSOSTki.OI.ApoE-/-) with AngII infusion. The white arrows indicated locations of aortic aneurysm (AA). Scale bars, 1 mm. (B) AA incidence in Col1a2+/G610C.ApoE-/- mice, hSOSTki.Col1a2+/G610C.ApoE-/- mice, and Δloop3-hSOSTki.Col1a2+/G610C.ApoE-/- mice with AngII infusion. A two-sided Chi-square test was performed to determine the difference between two groups. **** P < 0.0001. (C) Maximum diameters of aortic arches (left) and suprarenal aortas (right) from Col1a2+/G610C.ApoE-/- mice, hSOSTki.Col1a2+/G610C.ApoE-/- mice, and Δloop3-hSOSTki.Col1a2+/G610C.ApoE-/- mice with AngII infusion. (D) Representative micrographs of aortic roots from Col1a2+/G610C.ApoE-/- mice, hSOSTki.Col1a2+/G610C.ApoE-/- mice, and Δloop3-hSOSTki.Col1a2+/G610C.ApoE-/- mice stained with Oil Red O (left). Scale bar, 100μm (*lumen). Quantification of positive Oil Red O staining per cryo-section indicating the ratio of atherosclerotic plaque area to total cross cryo-section area of aortic root (%) (right). (E) Serum levels of inflammatory cytokines and chemokines in Col1a2+/G610C.ApoE-/- mice, hSOSTki.Col1a2+/G610C.ApoE-/- mice, and Δloop3-hSOSTki.Col1a2+/G610C.ApoE-/- mice with AngII infusion. (C-E) One-way ANOVA with Tukey's post-hoc test vs OI.ApoE-/- group was used to determine the inter-group differences. n = 9 per group. * P < 0.05; ** P < 0.01; *** P < 0.005; **** P < 0.0001. Note: AngII: Angiotensin II; IL-6: interleukin 6; TNF-α: tumor necrosis factor alpha; MCP-1: monocyte chemoattractant protein-1.
Figure 3
Figure 3
Loop3 played an important role in sclerostin's antagonistic effect on bone formation in Col1a2+/G610C mice in vivo. (A) Representative images showing three-dimensional trabecular architecture by micro-CT reconstruction at the proximal tibia of Col1a2+/G610C mice (OI), hSOSTki.Col1a2+/G610C mice (hSOSTki.OI), and Δloop3-hSOSTki.Col1a2+/G610C mice (Δloop3-hSOSTki.OI). Scale bars, 200 μm. (B) Bar charts of the structural parameters of Tb.BV/TV, Tb.vBMD, Tb.Th, Tb.N, Tb.Sp, Tb.conn.D and Tb.SMI from ex vivo micro-CT examination at the proximal tibia. (C) Representative fluorescent micrographs of the trabecular bone sections showing bone formation at the proximal tibia visualized by calcein green and xylenol orange labels. Arrows indicated the space between calcein green and xylenol orange labeling. Scale bars, 40 µm (the upper panel). Analysis of dynamic bone histomorphometric parameters of Tb.BFR/BS and Tb.MAR at the proximal tibia (the lower panel). Note: Tb.BV/TV: trabecular relative bone volume; Tb.vBMD: trabecular volumetric mineral density; Tb.Th: trabecular thickness; Tb.N: trabecular number; Tb.Sp: trabecular spacing; Tb.conn.D: trabecular connect density; Tb.SMI: trabecular structure model index; Tb.BFR/BS: trabecular bone formation rate; Tb.MAR: trabecular mineral apposition rate. Data were expressed as mean ± standard deviation. A two-sided Chi-square test was performed to determine the difference between groups. n = 10 per group. * P < 0.05; ** P < 0.01; *** P < 0.005; **** P < 0.0001.
Figure 4
Figure 4
Aptscl56 could bind to both recombinant sclerostin and sclerostin in the serum of the selected OI patients and healthy controls, via targeting loop3. (A) Western blot analysis for the binding between aptscl56 and full-length sclerostin (FL SOST). Aptscl56 was immobilized on magnetic beads and then untreated or pretreated with wild-type loop3 and wild-type loop2, respectively, followed by incubation with FL SOST (left). The density of detected bands in western blot analysis was quantitated (right). Values were the mean density for each band from three different experiments. Data were expressed as mean ± standard deviation. ^^^^ P < 0.0001 for a comparison of aptscl56+FL SOST group with aptscl56 group by a parried t-test. **** P < 0.0001 for a comparison of aptscl56+loop3+FL SOST, aptscl56+loop2+FL SOST, and aptscl56m+FL SOST with aptscl56+FL SOST group by one-way ANOVA with Tukey's post-hoc test. (B) The enzyme-linked immunosorbent assay for quantification of the serum sclerostin levels in the selected OI patients with different gene mutations (n = 2 for WNT1, n = 1 for TMEM38B, n = 1 for FKBP10 and n = 2 for BMP1) and healthy controls (n = 6). Data were expressed as mean ± standard deviation. A parried t-test was performed vs. Healthy controls to determine the difference between groups. ** P < 0.01. (C) Western blot analysis for the binding between aptscl56 and FL SOST in human serum from the above OI patients and healthy controls. Aptscl56 was immobilized on magnetic beads and then untreated or pretreated with wild-type loop3 and wild-type loop2, respectively, followed by incubation with the serum (left). The mean density of detected bands in western blot analysis was quantitated (right). Note: Data were expressed as mean ± standard deviation. ^^^^ P < 0.0001 for a comparison of OI+aptscl56 group with Healthy+aptscl56 group by a parried t-test. **** P < 0.0001 for a comparison of OI+aptscl56+loop3, OI+aptscl56+loop2, and OI+aptscl56m with OI+aptscl56 group by one-way ANOVA with Tukey's post-hoc test.
Figure 5
Figure 5
Aptscl56 inhibited sclerostin's antagonistic effect on Wnt signaling and osteogenic potential in primary osteoblasts isolated from Col1a2+/G610C mice via targeting loop3, while had no influence in sclerostin's suppressive effect on expression of inflammatory cytokines and chemokines in primary macrophages and aortic VSMCs isolated from Col1a2+/G610C.ApoE-/- mice in vitro. (A) The effect of aptscl56 and humanized therapeutic sclerostin antibody on sclerostin's antagonistic effect on Wnt signaling and osteogenic potential in osteoblasts from Col1a2+/G610C mice. *** P < 0.005 and **** P < 0.0001 for a comparison with Wnt+FL hSOST+veh by one-way ANOVA with Tukey's post-hoc test. (B) The influence of aptscl56 and humanized therapeutic sclerostin antibody on sclerostin's suppressive effect on mRNA expression of inflammatory cytokines (IL-6, TNF-α) and chemokine (MCP-1) in primary macrophages from Col1a2+/G610C.ApoE-/- mice with AngII treatment. (C) The influence of aptscl56 and humanized therapeutic sclerostin antibody on sclerostin's suppressive effect on mRNA expression of inflammatory chemokine (MCP-1) in aortic VSMCs from Col1a2+/G610C.ApoE-/- mice with AngII treatment. (B-C) * P < 0.05, ** P < 0.01, *** P < 0.005 and **** P < 0.0001 for a comparison with FL hSOST+AngII+veh by one-way ANOVA with Tukey's post-hoc test.
Figure 6
Figure 6
Apc001PE had no effect on aortic aneurysm (AA) progression in Col1a2+/G610C.ApoE-/- mice with AngII infusion. (A) Representative images of aortas from Col1a2+/G610C.ApoE-/- mice with AngII infusion, after administration of Apc001PE and sclerostin antibody with and without pretreatment of loop2m, respectively. The white arrows indicated the locations of aortic aneurysm (AA). Scale bars, 1 mm. (B) AA incidence of Col1a2+/G610C.ApoE-/- mice with AngII infusion. A two-sided Chi-square test was performed to determine the difference between two groups. *** P < 0.005. (C) Maximum diameters of thoracic aortas (left) and suprarenal aortas (right) from Col1a2+/G610C.ApoE-/- mice with AngII infusion. (D) Representative immunohistochemistry images for the expression of CD68, α-SMA, and cleaved caspase-3 in paraffin sections of suprarenal aortas from Col1a2+/G610C.ApoE-/- mice with AngII infusion (the upper panel: the black arrows and black circles indicated the locations of positive staining) and quantification of immunohistochemical analysis (the lower panel). Scale bars, 100 μm (*lumen). Data were expressed as mean ± standard deviation. n = 9 per group. * P < 0.05, ** P < 0.01, *** P < 0.005, and **** P < 0.0001 for a comparison with AngII+veh by One-way ANOVA with Tukey's post-hoc test. Note: AngII: Angiotensin II; CD68: macrophages biomarker; α-SMA: contractile cell biomarker; Cleaved caspase-3: apoptotic cell biomarker.
Figure 7
Figure 7
Apc001PE had no effect on inflammatory cytokines and chemokine expression, and atherosclerosis progression in Col1a2+/G610C.ApoE-/- mice with AngII infusion. (A) Maximum diameters of aortic arches from Col1a2+/G610C.ApoE-/- mice with AngII infusion. (B) Oil Red O staining of aortic arches for quantifying atherosclerosis in Col1a2+/G610C.ApoE-/- mice. Scale bars, 1 mm. (C) Representative micrographs of cross cryo-sections of aortic roots from Col1a2+/G610C.ApoE-/- mice stained with Oil Red O (left). Scale bars, 100 μm (*lumen). Quantification of positive staining per cryo-section (right). (D) Quantification of immunohistochemical analysis on the expression of CD68, α-SMA, and cleaved caspase-3 in cross cryo-sections of aortic roots from Col1a2+/G610C.ApoE-/- mice with AngII infusion. (E) Serum levels of inflammatory cytokines (IL-6, TNF-α) and chemokine (MCP-1) in Col1a2+/G610C.ApoE-/- mice with AngII infusion. Data were expressed as mean ± standard deviation. n = 9 per group. * P < 0.05, ** P < 0.01, *** P < 0.005, and **** P < 0.0001 for a comparison with AngII+veh by One-way ANOVA with Tukey's post-hoc test. Note: AngII: Angiotensin II; IL-6: interleukin 6; TNF-α: tumor necrosis factor alpha; MCP-1: monocyte chemoattractant protein-1; CD68: macrophages biomarker; α-SMA: contractile cell biomarker; Cleaved caspase-3: apoptotic cell biomarker.
Figure 8
Figure 8
Acp001PE had no influence in the protective effect of sclerostin on AA and atherosclerosis progression in hSOSTki.Col1a2+/G610C.ApoE-/- mice with AngII infusion. (A) Representative images of aortas from hSOSTki.Col1a2+/G610C.ApoE-/- mice and Col1a2+/G610C.ApoE-/- mice with AngII infusion, after administration of Apc001PE and sclerostin antibody, respectively. The white arrows indicated the locations of AAs. Scale bars, 1 mm. (B) AA incidence of hSOSTki.Col1a2+/G610C.ApoE-/- mice and Col1a2+/G610C.ApoE-/- mice with AngII infusion. A two-sided Chi-square test was performed to determine the difference between groups. **** P < 0.0001. (C) Maximum diameters of thoracic aortas (left) and suprarenal aortas (right) from hSOSTki.Col1a2+/G610C.ApoE-/- mice and Col1a2+/G610C.ApoE-/- mice with AngII infusion. (D) Maximum diameters of aortic arches. (E) Representative microphages of cross cryo-sections of aortic roots stained with Oil Red O (left). Scale bar, 100 μm (*lumen). Quantification of positive stain per cryo-section (right). (F) Serum levels of inflammatory cytokines (IL-6, TNF-α) and chemokine (MCP-1) in hSOSTki.Col1a2+/G610C.ApoE-/- mice and Col1a2+/G610C.ApoE-/- mice with AngII infusion. Data was expressed as mean ± standard deviation. n = 9 per group. (C-F) ** P < 0.01, *** P < 0.005, and **** P < 0.0001 for a comparison with hSOSTki.OI.ApoE-/--AngII+veh by one-way ANOVA with Tukey's post-hoc test. Note: AngII: Angiotensin II; IL-6: interleukin 6; TNF-α: tumor necrosis factor alpha; MCP-1: monocyte chemoattractant protein-1.
Figure 9
Figure 9
Apc001PE promoted bone formation at trabecular bone in Col1a2 +/G610C mice via targeting sclerostin loop3. (A) Representative images showing three-dimensional trabecular bone architecture by micro-CT reconstruction at the proximal tibia. Scale bars, 200 μm. (B) Bar charts of the structural parameters of Tb.BV/TV, Tb.vBMD, Tb.Th, Tb.N, Tb.Sp, Tb.conn.D and Tb.SMI from ex vivo micro-CT examination at the proximal tibia. (C) Representative fluorescent micrographs of the trabecular bone sections showing bone formation at the proximal tibia visualized by calcein green and xylenol orange labels. Arrows indicated the spaces between calcein green and xylenol orange labeling. Scale bars, 40 µm (the upper panel). Analysis of dynamic bone histomorphometric parameters of Tb.BFR/BS and Tb.MAR at the proximal tibia (the lower panel). Data were expressed as mean ± standard deviation followed by one-way ANOVA with Tukey's post-hoc test vs OI-Baseline, n = 10 per group. * P < 0.05; ** P < 0.01; *** P < 0.005; **** P < 0.0001.
Figure 10
Figure 10
Apc001PE promoted bone formation at cortical bone in Col1a2 +/G610C mice via targeting sclerostin loop3. (A) Representative images showing three-dimensional cortical bone architecture by micro-CT reconstruction at the femoral mid-shaft. Scale bars, 200 μm. (B) Bar charts of the structural parameters of Ct.PP and Ct.Th from ex vivo micro-CT examination at the femoral mid-shaft. (C) Representative fluorescent micrographs of the cortical bone sections showing bone formation at the femoral mid-shaft visualized by calcein green and xylenol orange labels. Arrows indicated the spaces between calcein green and xylenol orange labeling. Scale bars, 40 µm (the upper panel). Analysis of dynamic bone histomorphometric parameters of Ct.BFR/BS and Ct.MAR at the femoral mid-shaft (the lower panel). Note: Ct.PP: cortical Periosteal Perimeter; Ct.Th: cortical thickness; Ct.BFR/BS: total (endocortical plus periosteal) cortical bone formation rate; Ct.MAR/BS: total (endocortical plus periosteal) cortical mineral apposition rate. Data were expressed as mean ± standard deviation followed by one-way ANOVA with Tukey's post-hoc test vs OI-Baseline, n = 10 per group. * P < 0.05; ** P < 0.01; *** P < 0.005; **** P < 0.0001.
Figure 11
Figure 11
Apc001PE enhanced bone mechanical properties of Col1a2 +/G610C mice via targeting sclerostin loop3. (A) Compression test for the normalized value of failure force (left) and ultimate strength (middle) at the fifth lumbar vertebrae. Representative curves showing the mechanical properties of the fifth lumbar vertebrae by compression test (right). (B) Three-point bending test for the normalized value of failure force (the upper panel, left), stiffness (the upper panel, middle) and fracture energy (the upper panel, right) at the femoral mid-shaft. Representative curves showing the mechanical properties of the femoral mid-shaft by three-point bending test (the lower panel). Data were expressed as mean ± standard deviation followed by one-way ANOVA with Tukey's post-hoc test vs OI-Baseline, n = 10 per group. * P < 0.05; ** P < 0.01; *** P < 0.005; **** P < 0.0001.
Figure 12
Figure 12
Apc001PE inhibited the antagonistic effect of sclerostin on bone formation in hSOSTki.Col1a2 +/G610C mice via targeting sclerostin loop3, while Apc001PEm had no effect. (A) Representative images showing three-dimensional trabecular architecture by micro-CT reconstruction at the proximal tibia. Scale bars, 200 μm. (B) Bar charts of the structural parameters of Tb.BV/TV, Tb.vBMD, Tb.Th, Tb.N, Tb.Sp, Tb.conn.D and Tb.SMI from ex vivo micro-CT examination at the proximal tibia. (C) Representative fluorescent micrographs of the trabecular bone sections showing bone formation at the proximal tibia visualized by calcein green and xylenol orange labels. Arrows indicated the spaces between calcein green and xylenol orange labeling. Scale bars, 40 µm (the upper panel). Analysis of dynamic bone histomorphometric parameters of Tb.BFR/BS and Tb.MAR at the proximal tibia (the lower panel). Data were expressed as mean ± standard deviation followed by one-way ANOVA with Tukey's post-hoc test vs hSOSTki.OI-Baseline, n = 10 per group. * P < 0.05; ** P < 0.01; *** P < 0.005; **** P < 0.0001.

Similar articles

Cited by

References

    1. Marini JC, Forlino A, Bachinger HP, Bishop NJ, Byers PH, Paepe A. et al. Osteogenesis imperfecta. Nat Rev Dis Primers. 2017;3:17052. - PubMed
    1. Holdsworth G, Roberts SJ, Ke HZ. Novel actions of sclerostin on bone. J Mol Endocrinol. 2019;62:R167–R85. - PubMed
    1. Jacobsen CM, Barber LA, Ayturk UM, Roberts HJ, Deal LE, Schwartz MA. et al. Targeting the LRP5 pathway improves bone properties in a mouse model of osteogenesis imperfecta. J Bone Miner Res. 2014;29:2297–306. - PMC - PubMed
    1. Scheiber AL, Barton DK, Khoury BM, Marini JC, Swiderski DL, Caird MS. et al. Sclerostin Antibody-Induced Changes in Bone Mass Are Site Specific in Developing Crania. J Bone Miner Res. 2019;34:2301–10. - PMC - PubMed
    1. Cosman F, Crittenden DB, Adachi JD, Binkley N, Czerwinski E, Ferrari S. et al. Romosozumab Treatment in Postmenopausal Women with Osteoporosis. N Engl J Med. 2016;375:1532–43. - PubMed

Publication types