

Chemical fertilizer reduction combined with bio-organic fertilizers increases cauliflower yield via regulation of soil biochemical properties and bacterial communities in Northwest China
- PMID: 35966650
- PMCID: PMC9363920
- DOI: 10.3389/fmicb.2022.922149
Chemical fertilizer reduction combined with bio-organic fertilizers increases cauliflower yield via regulation of soil biochemical properties and bacterial communities in Northwest China
Abstract
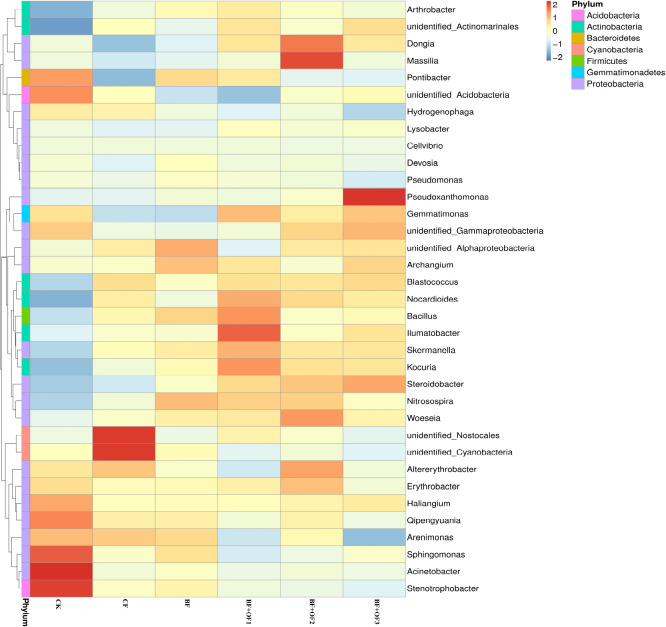
The continuous application of chemical fertilizers in vegetable cropping has led to deterioration of the soil environment and reduced yield and quality. The objective of this study was to evaluate the effect of combining chemical and bio-organic fertilizers on cauliflower yield, soil biochemical properties, and the bacterial community. Six treatments were established: no fertilizer (CK, control), chemical fertilizers (CF, conventional dosage for this region), balanced fertilization (BF, 30% reduction of chemical fertilizers), and balanced fertilization plus 3,000, 6,000, or 12,000 kg.ha-1 bio-organic fertilizer (Lvneng Ruiqi Biotechnology Co., Ltd., Gansu, China) (BF + OF1, BF + OF2, BF + OF3, respectively). A two-season field experiment with cauliflower was conducted under the different fertilizer treatments in irrigation districts along the Yellow River, Northwest China. The results indicate that the yield, soil organic matter, total potassium content, and enzyme activity under the bio-organic treatments were generally higher than those under the CF treatment. Compared with the CF treatment, the BF treatment increased soil organic matter content, enzyme activity and soil bacterial relative abundance. Moreover, the bacterial alpha-diversity were higher than those of conventional fertilization. The predominant phyla, including Proteobacteria, Actinobacteria, Gemmatimonadetes, and Chloroflexi, were the main contributors to the microbiome shift, as demonstrated by their remarkable enrichment in the soil under BF + OF2 and BF + OF3 treatments. Furthermore, Pearson correlation analyses show significant correlations among the soil organic matter, available P and K, electrical conductivity, and relative abundance of potentially beneficial microbial groups, such as the genera Massilia, Bacillus, Lysobacter, and Nitrosospira. Overall, this study suggests that balanced fertilization and the application of bio-organic fertilizers are essential to ensure soil fertility and long-term sustainable green productivity.
Keywords: bacterial community; bio-organic fertilizer; cauliflower; soil property; yield.
Copyright © 2022 Xiao, Li, Lyu, Feng, Zhang, Yang, Gao, Jin and Yu.
Conflict of interest statement
The authors declare that the research was conducted in the absence of any commercial or financial relationships that could be construed as a potential conflict of interest.
Figures


Similar articles
-
[Effects of Different Microbial Fertilizers on Soil Quality and Maize Yield in Coastal Saline Soil].Huan Jing Ke Xue. 2024 Jul 8;45(7):4279-4292. doi: 10.13227/j.hjkx.202307148. Huan Jing Ke Xue. 2024. PMID: 39022973 Chinese.
-
[Response of Bacterial and Fungal Communities to Chemical Fertilizer Reduction Combined with Organic Fertilizer and Straw in Fluvo-aquic Soil].Huan Jing Ke Xue. 2020 Oct 8;41(10):4669-4681. doi: 10.13227/j.hjkx.202003068. Huan Jing Ke Xue. 2020. PMID: 33124400 Chinese.
-
Bio-organic fertilizer with reduced rates of chemical fertilization improves soil fertility and enhances tomato yield and quality.Sci Rep. 2020 Jan 13;10(1):177. doi: 10.1038/s41598-019-56954-2. Sci Rep. 2020. PMID: 31932626 Free PMC article.
-
Effects of nitrogen reduction combined with bio-organic fertilizer on soil bacterial community diversity of red raspberry orchard.PLoS One. 2023 Jul 11;18(7):e0283718. doi: 10.1371/journal.pone.0283718. eCollection 2023. PLoS One. 2023. PMID: 37432967 Free PMC article.
-
Reduced Chemical Fertilizer Combined With Bio-Organic Fertilizer Affects the Soil Microbial Community and Yield and Quality of Lettuce.Front Microbiol. 2022 Apr 21;13:863325. doi: 10.3389/fmicb.2022.863325. eCollection 2022. Front Microbiol. 2022. PMID: 35531292 Free PMC article.
Cited by
-
Effects of green manure planting mode on the quality of Korla fragrant pears (Pyrus sinkiangensis Yu).Front Plant Sci. 2022 Nov 29;13:1027595. doi: 10.3389/fpls.2022.1027595. eCollection 2022. Front Plant Sci. 2022. PMID: 36523625 Free PMC article.
-
Transforming Agricultural and Sulfur Waste into Fertilizer: Assessing the Short-Term Effects on Microbial Biodiversity via a Metagenomic Approach.Life (Basel). 2024 Dec 9;14(12):1633. doi: 10.3390/life14121633. Life (Basel). 2024. PMID: 39768341 Free PMC article.
-
Optimization of composite microbial agents containing plant inter-root growth-promoting bacteria and verification using mini Chinese cabbage (Brassica rapa L. ssp. Pekinensis).Front Plant Sci. 2025 May 21;16:1563932. doi: 10.3389/fpls.2025.1563932. eCollection 2025. Front Plant Sci. 2025. PMID: 40470372 Free PMC article.
-
Effects of organic fertilizer replacement on the microbial community structure in the rhizosphere soil of soybeans in albic soil.Sci Rep. 2025 Apr 10;15(1):12271. doi: 10.1038/s41598-025-96463-z. Sci Rep. 2025. PMID: 40210963 Free PMC article.
-
Effects of peach branch organic fertilizer on the soil microbial community in peach orachards.Front Microbiol. 2023 Jul 7;14:1223420. doi: 10.3389/fmicb.2023.1223420. eCollection 2023. Front Microbiol. 2023. PMID: 37485500 Free PMC article.
References
-
- Aparna K., Pasha M. A., Rao D. L. N., Krishnaraj P. U. (2014). Organic amendments as ecosystem engineers: microbial, biochemical and genomic evidence of soil health improvement in a tropical arid zone field site. Ecol. Eng. 71 268–277. 10.1016/j.ecoleng.2014.07.016 - DOI
-
- Apprill A., Mcnally S., Parsons R., Weber L. (2015). Minor revision to V4 region SSU rRNA 806R gene primer greatly increases detection of SAR11 bacterioplankton. Aquat. Microb. Ecol. 75 129–137.
-
- Baldi E., Marcolini G., Quartieri M., Sorrenti G., Muzzi E., Toselli M. (2016). Organic fertilization in nectarine (Prunus persica var. nucipersica) orchard combines nutrient management and pollution impact. Nutr. Cycl. Agroecosyst. 105 39–50. 10.1007/s10705-016-9772-3 - DOI
-
- Brenzinger K., Costa O., Ho A., Koorneef G., Robroek B., Molenaar D., et al. (2021). Steering microbiomes by organic amendments towards climate-smart agricultural soils. Biol. Fertil. Soils 57 1053–1074.
LinkOut - more resources
Full Text Sources
Research Materials
Miscellaneous