. 2022 Jul 28:13:934993.
doi: 10.3389/fmicb.2022.934993. eCollection 2022.

Dynamics of Viral Infection and Evolution of SARS-CoV-2 Variants in the Calabria Area of Southern Italy

Affiliations

Dynamics of Viral Infection and Evolution of SARS-CoV-2 Variants in the Calabria Area of Southern Italy

Carmela De Marco et al. Front Microbiol. .

Abstract

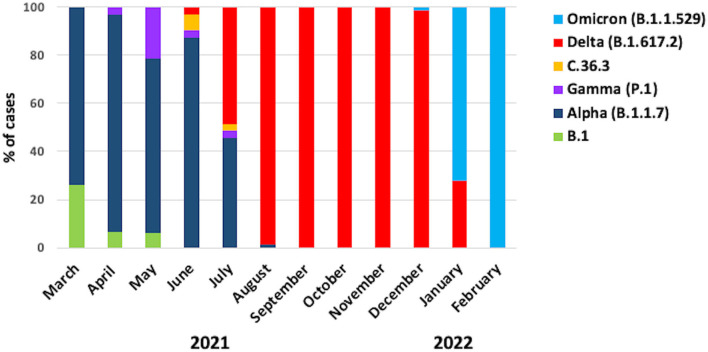
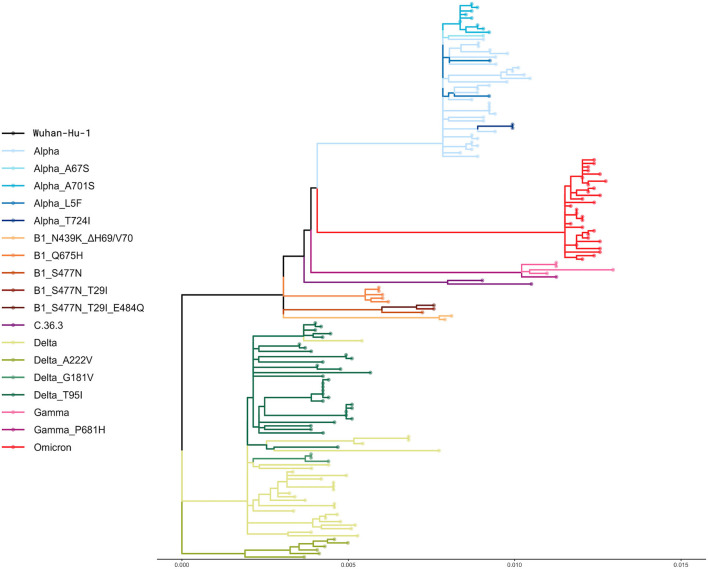
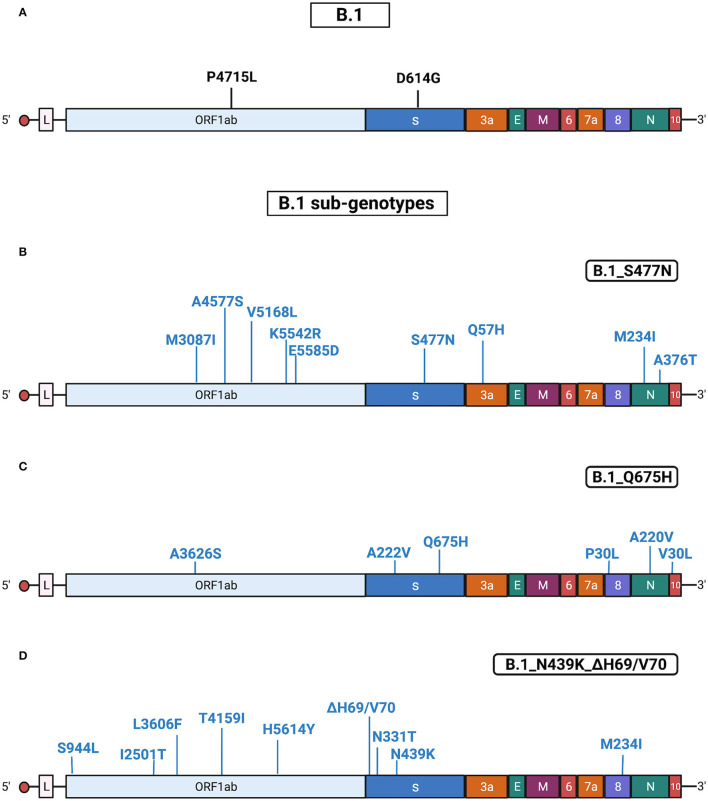
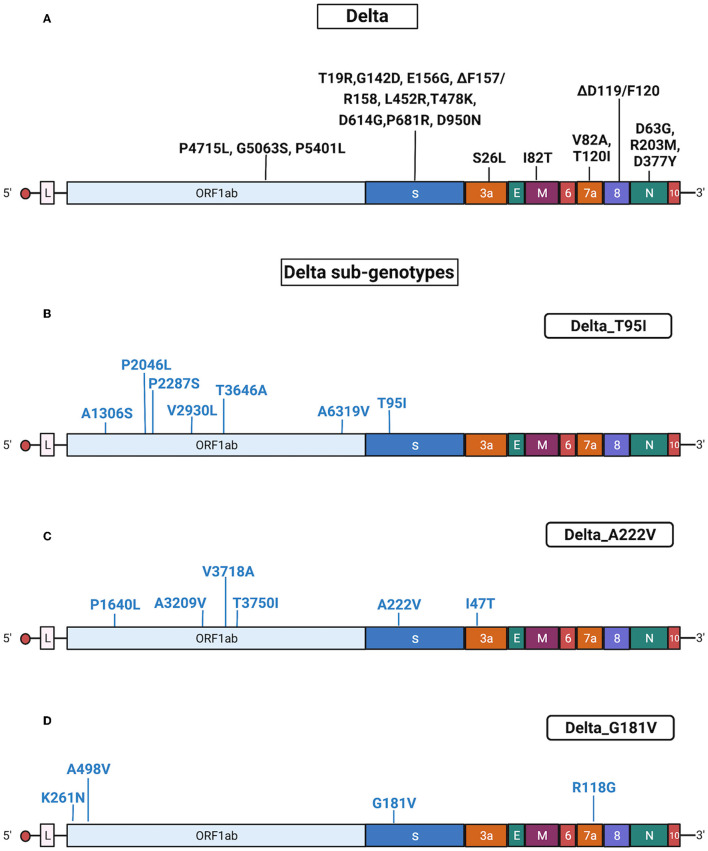
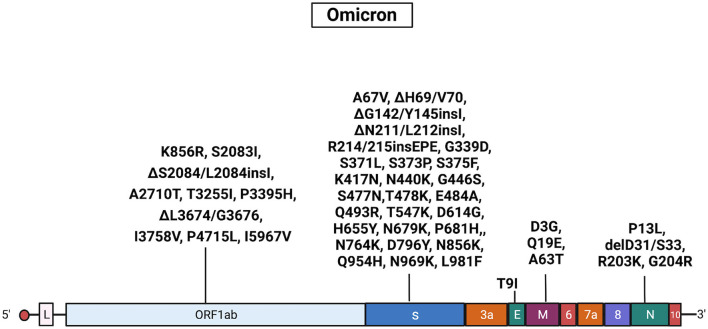
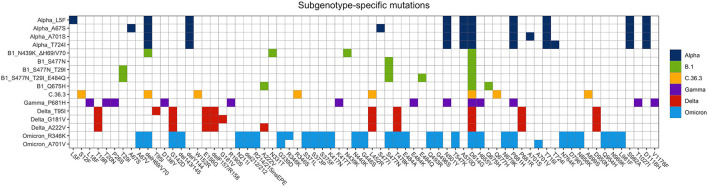
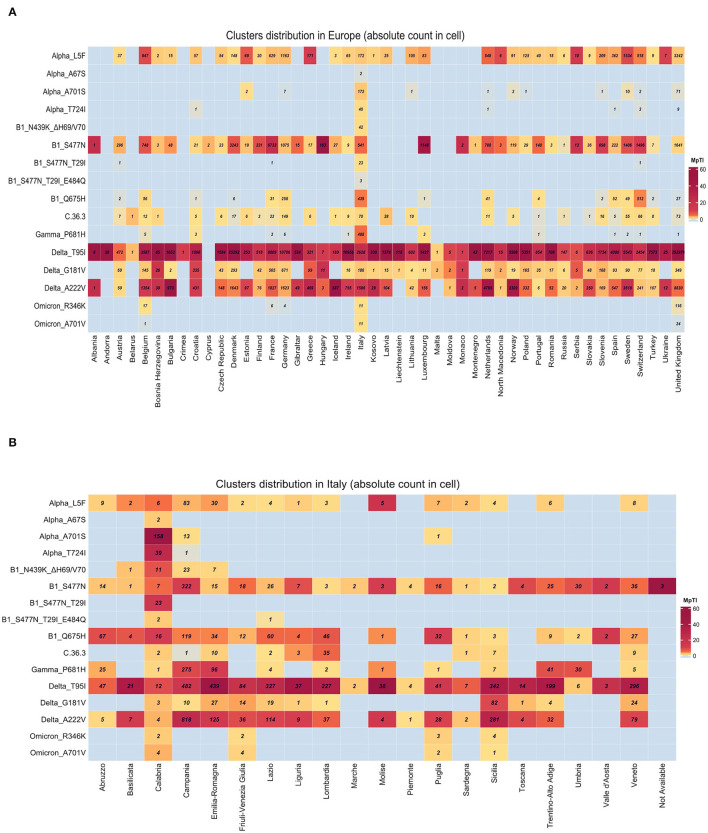
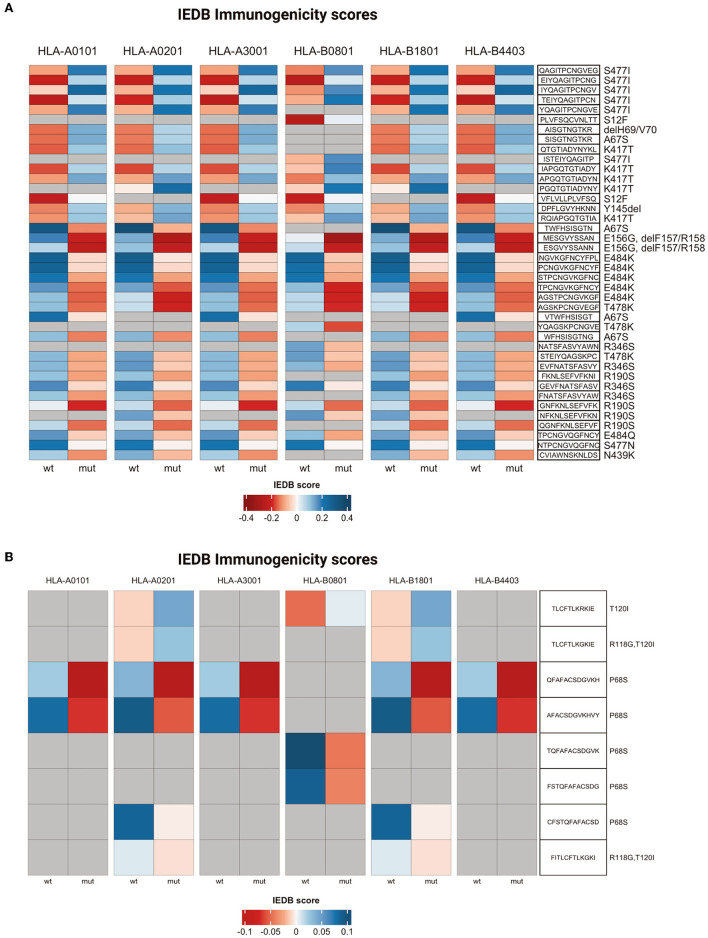
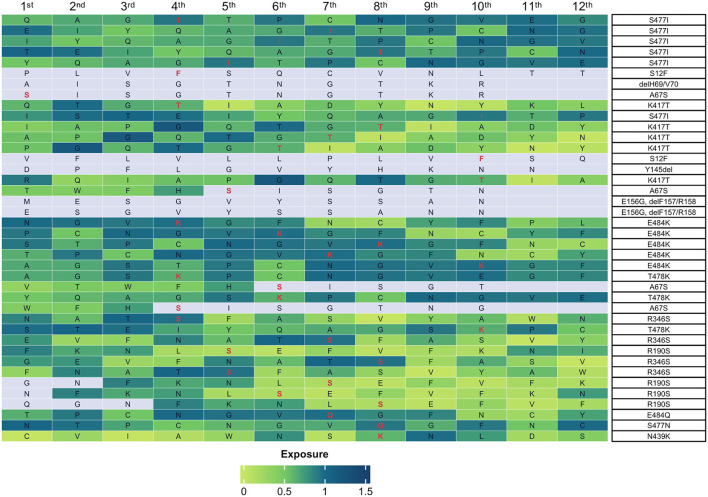
In this study, we report on the results of SARS-CoV-2 surveillance performed in an area of Southern Italy for 12 months (from March 2021 to February 2022). To this study, we have sequenced RNA from 609 isolates. We have identified circulating VOCs by Sanger sequencing of the S gene and defined their genotypes by whole-genome NGS sequencing of 157 representative isolates. Our results indicated that B.1 and Alpha were the only circulating lineages in Calabria in March 2021; while Alpha remained the most common variant between April 2021 and May 2021 (90 and 73%, respectively), we observed a concomitant decrease in B.1 cases and appearance of Gamma cases (6 and 21%, respectively); C.36.3 and Delta appeared in June 2021 (6 and 3%, respectively); Delta became dominant in July 2021 while Alpha continued to reduce (46 and 48%, respectively). In August 2021, Delta became the only circulating variant until the end of December 2021. As of January 2022, Omicron emerged and took over Delta (72 and 28%, respectively). No patient carrying Beta, Iota, Mu, or Eta variants was identified in this survey. Among the genomes identified in this study, some were distributed all over Europe (B1_S477N, Alpha_L5F, Delta_T95, Delta_G181V, and Delta_A222V), some were distributed in the majority of Italian regions (B1_S477N, B1_Q675H, Delta_T95I and Delta_A222V), and some were present mainly in Calabria (B1_S477N_T29I, B1_S477N_T29I_E484Q, Alpha_A67S, Alpha_A701S, and Alpha_T724I). Prediction analysis of the effects of mutations on the immune response (i.e., binding to class I MHC and/or recognition of T cells) indicated that T29I in B.1 variant; A701S in Alpha variant; and T19R in Delta variant were predicted to impair binding to class I MHC whereas the mutations A67S identified in Alpha; E484K identified in Gamma; and E156G and ΔF157/R158 identified in Delta were predicted to impair recognition by T cells. In conclusion, we report on the results of SARS-CoV-2 surveillance in Regione Calabria in the period between March 2021 and February 2022, identified variants that were enriched mainly in Calabria, and predicted the effects of identified mutations on host immune response.

Keywords: NGS; SARS-CoV-2; immunogenomics; surveillance; variants.


Conflict of interest statement

The authors declare that the research was conducted in the absence of any commercial or financial relationships that could be construed as a potential conflict of interest.

Figures

Figure 1
Figure 1
Frequency of the SARS-CoV-2 variants. The graph shows the frequencies of the different variants in the cohort of patients from Regione Calabria in the period between March 2021 and February 2022.
Figure 2
Figure 2
Phylogenetic analysis. The phylogenetic tree shows the genetic relationship between the 157 whole genomes included in this study. A default bootstrap equal to 100 was used. The genetic distance is reported at the bottom.
Figure 3
Figure 3
Substitutions in B.1 isolates. The figure shows the substitutions identified in the B.1 isolates by NGS. Color code: black, substitutions common to all B.1 isolates; blue, substitutions specific for the different B.1 sub-genotypes. (A) Substitutions common to all B.1 isolates. (B) Substitutions identified in all B.1 isolates characterized by the presence of S477N (sub-genotype B.1_S477N). (C) Substitutions identified in all B.1 isolates characterized by the presence of Q675H (sub-genotype B.1_Q675H). (D) Substitutions identified in all the B.1 isolates characterized by the presence of N439K/ΔH69-ΔV70 (sub-genotype B.1_N439K/ΔH69-ΔV70). Gene abbreviations: ORF, open reading frame; S, Spike; E, envelope; M, membrane; N, nucleocapsid. Adapted from “Genome Organization of SARS-CoV” by BioRender.com (2022). Retrieved from https://app.biorender.com/biorender-templates.
Figure 4
Figure 4
Substitutions in Alpha isolates. The figure shows the substitutions identified in the Alpha isolates by NGS. Color code: black, substitutions common to all Alpha isolates; blue, substitutions specific for the different Alpha sub-genotypes. (A) Substitutions common to all Alpha isolates. (B) Substitutions identified in all Alpha isolates characterized by the presence of A701S (sub-genotype Alpha_A701S). (C) Substitutions identified in all Alpha isolates characterized by the presence of T724I (sub-genotype Alpha_T724I). Gene abbreviations: ORF, open reading frame; S, Spike; E, envelope; M, membrane; N, nucleocapsid. Adapted from “Genome Organization of SARS-CoV” by BioRender.com (2022). Retrieved from https://app.biorender.com/biorender-templates.
Figure 5
Figure 5
Substitutions in Delta isolates. The figure shows the substitutions identified in the Delta isolates by NGS. Color code: black, substitutions common to all Delta isolates; blue, substitutions specific for the different Delta sub-genotypes. (A) Substitutions common to all Delta isolates. (B) Substitutions identified in all Delta isolates characterized by the presence of T95I (sub-genotype Delta_T95I). (C) Substitutions identified in all Delta isolates characterized by the presence of A222V (sub-genotype Delta_A222V). (D) Substitutions identified in all Delta isolates characterized by the presence of G181V (sub-genotype Delta_ G181V). Gene abbreviations: ORF, open reading frame; S, Spike; E, envelope; M, membrane; N, nucleocapsid. Adapted from “Genome Organization of SARS-CoV” by BioRender.com (2022). Retrieved from https://app.biorender.com/biorender-templates.
Figure 6
Figure 6
Mutations in Omicron isolates. The figure shows the substitutions identified in the Omicron isolates by NGS. Black, substitutions common to all Omicron isolates. Gene abbreviations: ORF, open reading frame; S, Spike; E, envelope; M, membrane; N, nucleocapsid. Adapted from “Genome Organization of SARS-CoV” by BioRender.com (2022). Retrieved from https://app.biorender.com/biorender-templates.
Figure 7
Figure 7
Distribution of mutations identified in the different variants' sub-genotypes. The chart reports the mutations that characterize the different variants' sub-genotypes identified in this study.
Figure 8
Figure 8
Geographical distribution of the different variants' sub-genotypes. Heatmaps show the distribution of the different sequences available in GISAID database. Numbers within the boxes represent the absolute numbers of sub-genotypes characterized by the presence of the mutations indicated on the left side among European countries (A) or Italian regions (B). Variations per Thousand Isolates more than 10 are plotted.
Figure 9
Figure 9
T cell immunogenicity analysis. Heatmaps representing T cell immunogenicity scores for wild-type and mutated peptides from Spike (A) or ORF7a (B). IEDB scores range from dark red (low immunogenicity) to blue (high immunogenicity).
Figure 10
Figure 10
Accessibility of mutant peptides on surface of the S protein. The heatmap shows the accessibility scores of peptides containing the residues indicated on the right. Boxes represent the amino acid residue under analysis. The mutations present in the sub-genotypes identified in this study are highlighted in red. The accessibility score is indicated by the shades of green on the scale from 0 (light green, no exposure) to 1.5 (dark green, high exposure). The color gray indicates that no exposure score is available.

Similar articles

Cited by

References

    1. Andreatta M., Nielsen M. (2016). Gapped sequence alignment using artificial neural networks: application to the MHC class I system. Bioinformatics 32, 511–517. 10.1093/bioinformatics/btv639 - DOI - PMC - PubMed
    1. Basu S., Chakravarty D., Bhattacharyya D., Saha P., Patra H. K. (2021). Plausible blockers of Spike RBD in SARS-CoV-2-molecular design and underlying interaction dynamics from high-level structural descriptors. J. Mol. Model 27, 191. 10.1007/s00894-021-04779-0 - DOI - PMC - PubMed
    1. Bendell C. J., Liu S., Aumentado-Armstrong T., Istrate B., Cernek P. T., Khan S., et al. . (2014). Transient protein-protein interface prediction: datasets, features, algorithms, and the RAD-T predictor. BMC Bioinformatics 15, 82. 10.1186/1471-2105-15-82 - DOI - PMC - PubMed
    1. Berman H. M., Westbrook J., Feng Z., Gilliland G., Bhat T. N., Weissig H., et al. . (2000). The protein data bank. Nucleic Acids Res. 28, 235–242. 10.1093/nar/28.1.235 - DOI - PMC - PubMed
    1. Brejová B., Boršová K., Hodorová V., Cabanová V., Reizigová L., Paul E. D., et al. . (2021). A SARS-CoV-2 mutant from B.1.258 lineage with ΔH69/ΔV70 deletion in the Spike protein circulating in Central Europe in the fall 2020. Virus Genes. 57, 556-560. 10.1007/s11262-021-01866-5 - DOI - PMC - PubMed