Liver fat metabolism of broilers regulated by Bacillus amyloliquefaciens TL via stimulating IGF-1 secretion and regulating the IGF signaling pathway
- PMID: 35966703
- PMCID: PMC9363834
- DOI: 10.3389/fmicb.2022.958112
Liver fat metabolism of broilers regulated by Bacillus amyloliquefaciens TL via stimulating IGF-1 secretion and regulating the IGF signaling pathway
Abstract
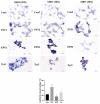
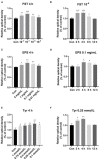
Bacillus amyloliquefaciens TL (B.A-TL) is well-known for its capability of promoting protein synthesis and lipid metabolism, in particular, the abdominal fat deposition in broilers. However, the underlying molecular mechanism remains unclear. In our study, the regulations of lipid metabolism of broilers by B.A-TL were explored both in vivo and in vitro. The metabolites of B.A-TL were used to simulate in vitro the effect of B.A-TL on liver metabolism based on the chicken hepatocellular carcinoma cell line (i.e., LMH cells). The effects of B.A-TL on lipid metabolism by regulating insulin/IGF signaling pathways were investigated by applying the signal pathway inhibitors in vitro. The results showed that the B.A-TL metabolites enhanced hepatic lipid synthesis and stimulated the secretion of IGF-1. The liver transcriptome analysis revealed the significantly upregulated expressions of four genes (SI, AMY2A, PCK1, and FASN) in the B.A-TL treatment group, mainly involved in carbohydrate digestion and absorption as well as biomacromolecule metabolism, with a particularly prominent effect on fatty acid synthase (FASN). Results of cellular assays showed that B.A-TL metabolites were involved in the insulin/IGF signaling pathway, regulating the expressions of lipid metabolism genes (e.g., FASN, ACCα, LPIN, and ACOX) and the FASN protein, ultimately regulating the lipid metabolism via the IGF/PI3K/FASN pathway in broilers.
Keywords: Bacillus amyloliquefaciens TL; IGF signaling pathway; broilers; fatty acid synthase; insulin-like factor 1; lipid metabolism; liver.
Copyright © 2022 Chen, Li, Zhou, Wang, Shi, Li, Li and Xiao.
Figures


Similar articles
-
Bacillus amyloliquefaciens TL Downregulates the Ileal Expression of Genes Involved in Immune Responses in Broiler Chickens to Improve Growth Performance.Microorganisms. 2021 Feb 13;9(2):382. doi: 10.3390/microorganisms9020382. Microorganisms. 2021. PMID: 33668643 Free PMC article.
-
Effect of Morinda citrifolia (Noni)-Enriched Diet on Hepatic Heat Shock Protein and Lipid Metabolism-Related Genes in Heat Stressed Broiler Chickens.Front Physiol. 2017 Nov 27;8:919. doi: 10.3389/fphys.2017.00919. eCollection 2017. Front Physiol. 2017. PMID: 29230177 Free PMC article.
-
Transcriptome Analysis Reveals Regulation of Gene Expression for Lipid Catabolism in Young Broilers by Butyrate Glycerides.PLoS One. 2016 Aug 10;11(8):e0160751. doi: 10.1371/journal.pone.0160751. eCollection 2016. PLoS One. 2016. PMID: 27508934 Free PMC article.
-
Cooperation of liver cells in health and disease.Adv Anat Embryol Cell Biol. 2001;161:III-XIII, 1-151. doi: 10.1007/978-3-642-56553-3. Adv Anat Embryol Cell Biol. 2001. PMID: 11729749 Review.
-
Insulin-Like Growth Factor 1 (IGF-1) Signaling in Glucose Metabolism in Colorectal Cancer.Int J Mol Sci. 2021 Jun 16;22(12):6434. doi: 10.3390/ijms22126434. Int J Mol Sci. 2021. PMID: 34208601 Free PMC article. Review.
Cited by
-
Decoding chicken growth regulation through multi-omics insights and emerging genetic tools for growth optimization.Poult Sci. 2025 Jul 5;104(10):105542. doi: 10.1016/j.psj.2025.105542. Online ahead of print. Poult Sci. 2025. PMID: 40652768 Free PMC article. Review.
-
Economic and Productive Comparison of Rutin and Rutin-Loaded Chitosan Alginate Nanoparticles Against Lead-Induced Oxidative Stress in Cobb and Arbor Broiler Breeds.Biol Trace Elem Res. 2024 Oct;202(10):4715-4734. doi: 10.1007/s12011-023-04019-x. Epub 2023 Dec 28. Biol Trace Elem Res. 2024. PMID: 38153670 Free PMC article.
-
Effect of Bacillus amyloliquefaciens supplementation on intramuscular fat accumulation and meat quality in finishing pigs.Anim Biosci. 2025 Mar;38(3):551-559. doi: 10.5713/ab.24.0399. Epub 2024 Oct 25. Anim Biosci. 2025. PMID: 39483026 Free PMC article.
-
Bacillus amyloliquefaciens TL promotes gut health of broilers by the contribution of bacterial extracellular polysaccharides through its anti-inflammatory potential.Front Immunol. 2024 Sep 23;15:1455996. doi: 10.3389/fimmu.2024.1455996. eCollection 2024. Front Immunol. 2024. PMID: 39376562 Free PMC article.
-
Insect fat influences broiler performance, meat quality, and the cecal microbiota similarly to plant oils rather than animal fats.Sci Rep. 2025 May 24;15(1):18086. doi: 10.1038/s41598-025-02820-3. Sci Rep. 2025. PMID: 40413284 Free PMC article.
References
LinkOut - more resources
Full Text Sources
Miscellaneous

