

Identification of diagnostic signatures associated with immune infiltration in Alzheimer's disease by integrating bioinformatic analysis and machine-learning strategies
- PMID: 35966794
- PMCID: PMC9372364
- DOI: 10.3389/fnagi.2022.919614
Identification of diagnostic signatures associated with immune infiltration in Alzheimer's disease by integrating bioinformatic analysis and machine-learning strategies
Abstract
Objective: As a chronic neurodegenerative disorder, Alzheimer's disease (AD) is the most common form of progressive dementia. The purpose of this study was to identify diagnostic signatures of AD and the effect of immune cell infiltration in this pathology.
Methods: The expression profiles of GSE109887, GSE122063, GSE28146, and GSE1297 were downloaded from the Gene Expression Omnibus (GEO) database to obtain differentially expressed genes (DEGs) between AD and control brain samples. Functional enrichment analysis was performed to reveal AD-associated biological functions and key pathways. Besides, we applied the Least Absolute Shrinkage Selection Operator (LASSO) and support vector machine-recursive feature elimination (SVM-RFE) analysis to screen potential diagnostic feature genes in AD, which were further tested in AD brains of the validation cohort (GSE5281). The discriminatory ability was then assessed by the area under the receiver operating characteristic curves (AUC). Finally, the CIBERSORT algorithm and immune cell infiltration analysis were employed to assess the inflammatory state of AD.
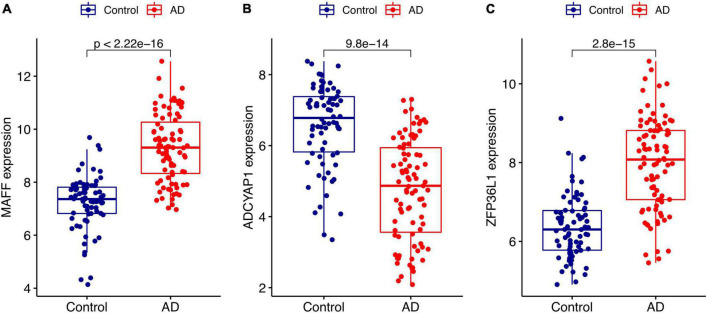
Results: A total of 49 DEGs were identified. The functional enrichment analysis revealed that leukocyte transendothelial migration, cytokine receptor interaction, and JAK-STAT signaling pathway were enriched in the AD group. MAF basic leucine zipper transcription factor F (MAFF), ADCYAP1, and ZFP36L1 were identified as the diagnostic biomarkers of AD with high discriminatory ability (AUC = 0.850) and validated in AD brains (AUC = 0.935). As indicated from the immune cell infiltration analysis, naive B cells, plasma cells, activated/resting NK cells, M0 macrophages, M1 macrophages, resting CD4+ T memory cells, resting mast cells, memory B cells, and resting/activated dendritic cells may participate in the development of AD. Additionally, all diagnostic signatures presented different degrees of correlation with different infiltrating immune cells.
Conclusion: MAFF, ADCYAP1, and ZFP36L1 may become new candidate biomarkers of AD, which were closely related to the pathogenesis of AD. Moreover, the immune cells mentioned above may play crucial roles in disease occurrence and progression.
Keywords: Alzheimer’s disease; bioinformatic analysis; diagnostic biomarkers; immune cell infiltration; machine-learning strategies.
Copyright © 2022 Tian, Lu, Cao, Dang, Wang, Tian, Luo, Guo, Luo, Wang and Li.
Conflict of interest statement
The authors declare that the research was conducted in the absence of any commercial or financial relationships that could be construed as a potential conflict of interest.
Figures


Similar articles
-
Deciphering the role of lipid metabolism-related genes in Alzheimer's disease: a machine learning approach integrating Traditional Chinese Medicine.Front Endocrinol (Lausanne). 2024 Oct 23;15:1448119. doi: 10.3389/fendo.2024.1448119. eCollection 2024. Front Endocrinol (Lausanne). 2024. PMID: 39507054 Free PMC article.
-
Identification of novel biomarkers and immune infiltration characteristics of ischemic stroke based on comprehensive bioinformatic analysis and machine learning.Biochem Biophys Rep. 2023 Dec 7;37:101595. doi: 10.1016/j.bbrep.2023.101595. eCollection 2024 Mar. Biochem Biophys Rep. 2023. PMID: 38371524 Free PMC article.
-
Development of a novel immune infiltration-related diagnostic model for Alzheimer's disease using bioinformatic strategies.Front Immunol. 2023 Jul 20;14:1147501. doi: 10.3389/fimmu.2023.1147501. eCollection 2023. Front Immunol. 2023. PMID: 37545529 Free PMC article.
-
Integrated identification of key immune related genes and patterns of immune infiltration in calcified aortic valvular disease: A network based meta-analysis.Front Genet. 2022 Sep 21;13:971808. doi: 10.3389/fgene.2022.971808. eCollection 2022. Front Genet. 2022. PMID: 36212153 Free PMC article.
-
A review and analysis of key biomarkers in Alzheimer's disease.Front Neurosci. 2024 Feb 20;18:1358998. doi: 10.3389/fnins.2024.1358998. eCollection 2024. Front Neurosci. 2024. PMID: 38445255 Free PMC article. Review.
Cited by
-
Six mitophagy-related hub genes as peripheral blood biomarkers of Alzheimer's disease and their immune cell infiltration correlation.Front Neurosci. 2023 May 18;17:1125281. doi: 10.3389/fnins.2023.1125281. eCollection 2023. Front Neurosci. 2023. PMID: 37274215 Free PMC article.
-
Systematic Identification of Mitochondrial Signatures in Alzheimer's Disease and Inflammatory Bowel Disease.Mol Neurobiol. 2025 Jul;62(7):9089-9119. doi: 10.1007/s12035-025-04826-4. Epub 2025 Mar 14. Mol Neurobiol. 2025. PMID: 40085351
-
Transcriptomic Analysis of Lipid Metabolism Genes in Alzheimer's Disease: Highlighting Pathological Outcomes and Compartmentalized Immune Status.J Mol Neurosci. 2024 May 22;74(2):55. doi: 10.1007/s12031-024-02225-3. J Mol Neurosci. 2024. PMID: 38776015
-
A Reproducibility Focused Meta-Analysis Method for Single-Cell Transcriptomic Case-Control Studies Uncovers Robust Differentially Expressed Genes.bioRxiv [Preprint]. 2025 Jun 11:2024.10.15.618577. doi: 10.1101/2024.10.15.618577. bioRxiv. 2025. PMID: 39463993 Free PMC article. Preprint.
-
Exercise training exerts beneficial effects on Alzheimer's disease through multiple signaling pathways.Front Aging Neurosci. 2025 May 21;17:1558078. doi: 10.3389/fnagi.2025.1558078. eCollection 2025. Front Aging Neurosci. 2025. PMID: 40469843 Free PMC article. Review.
References
-
- Ciaramella A., Salani F., Bizzoni F., Orfei M. D., Caltagirone C., Spalletta G., et al. (2016). Myeloid dendritic cells are decreased in peripheral blood of Alzheimer’s Disease patients in association with disease progression and severity of depressive symptoms. J. Neuroinfl. 13:18. 10.1186/s12974-016-0483-0 - DOI - PMC - PubMed
LinkOut - more resources
Full Text Sources
Other Literature Sources
Research Materials