

Associations of multiple visual rating scales based on structural magnetic resonance imaging with disease severity and cerebrospinal fluid biomarkers in patients with Alzheimer's disease
- PMID: 35966797
- PMCID: PMC9374170
- DOI: 10.3389/fnagi.2022.906519
Associations of multiple visual rating scales based on structural magnetic resonance imaging with disease severity and cerebrospinal fluid biomarkers in patients with Alzheimer's disease
Abstract
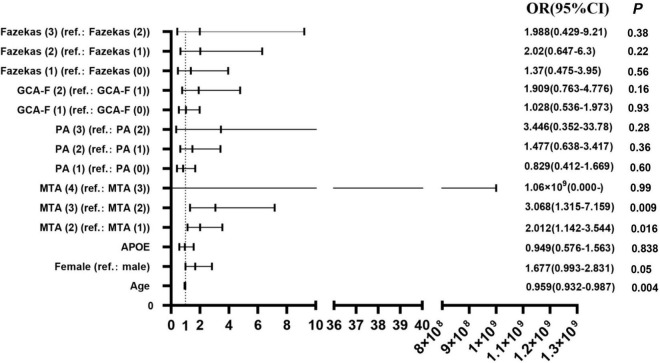
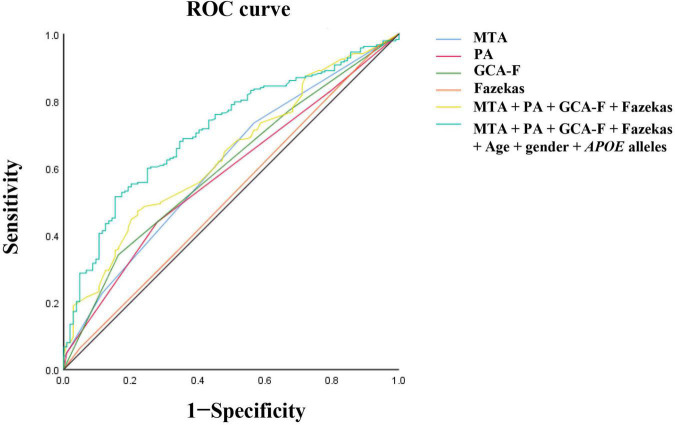
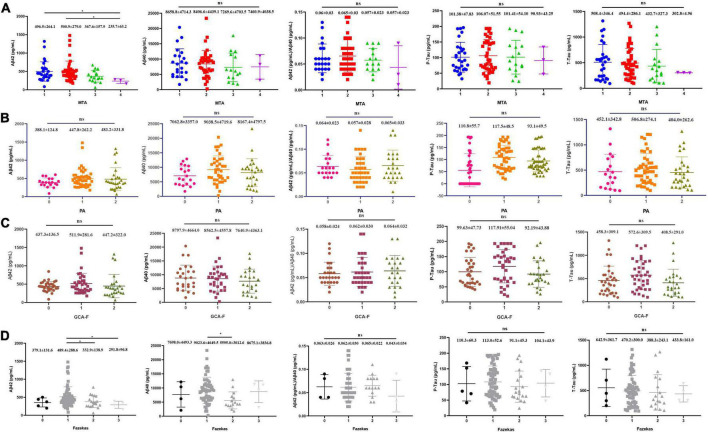
The relationships between multiple visual rating scales based on structural magnetic resonance imaging (sMRI) with disease severity and cerebrospinal fluid (CSF) biomarkers in patients with Alzheimer's disease (AD) were ambiguous. In this study, a total of 438 patients with clinically diagnosed AD were recruited. All participants underwent brain sMRI scan, and medial temporal lobe atrophy (MTA), posterior atrophy (PA), global cerebral atrophy-frontal sub-scale (GCA-F), and Fazekas rating scores were visually evaluated. Meanwhile, disease severity was assessed by neuropsychological tests such as the Mini-Mental State Examination (MMSE), Montreal Cognitive Assessment (MoCA), and Clinical Dementia Rating (CDR). Among them, 95 patients were tested for CSF core biomarkers, including Aβ1-42, Aβ1-40, Aβ1-42/Aβ1-40, p-tau, and t-tau. As a result, the GCA-F and Fazekas scales showed positively significant correlations with onset age (r = 0.181, p < 0.001; r = 0.411, p < 0.001, respectively). Patients with late-onset AD (LOAD) showed higher GCA-F and Fazekas scores (p < 0.001, p < 0.001). With regard to the disease duration, the MTA and GCA-F were positively correlated (r = 0.137, p < 0.05; r = 0.106, p < 0.05, respectively). In terms of disease severity, a positively significant association emerged between disease severity and the MTA, PA GCA-F, and Fazekas scores (p < 0.001, p < 0.001, p < 0.001, p < 0.05, respectively). Moreover, after adjusting for age, gender, and APOE alleles, the MTA scale contributed to moderate to severe AD in statistical significance independently by multivariate logistic regression analysis (p < 0.05). The model combining visual rating scales, age, gender, and APOE alleles showed the best performance for the prediction of moderate to severe AD significantly (AUC = 0.712, sensitivity = 51.5%, specificity = 84.6%). In addition, we observed that the MTA and Fazekas scores were associated with a lower concentration of Aβ1-42 (p < 0.031, p < 0.022, respectively). In summary, we systematically analyzed the benefits of multiple visual rating scales in predicting the clinical status of AD. The visual rating scales combined with age, gender, and APOE alleles showed best performance in predicting the severity of AD. MRI biomarkers in combination with CSF biomarkers can be used in clinical practice.
Keywords: Alzheimer’s disease; cerebrospinal fluid; global cerebral frontal atrophy; medial temporal lobe atrophy; posterior atrophy; visual rating scale; white matter lesions.
Copyright © 2022 Wan, Liu, Liu, Zhang, Xiao, Zhang, Jiang, Zhou, Liao, Zhou, Tang, Wang, Guo, Jiao and Shen.
Conflict of interest statement
The authors declare that the research was conducted in the absence of any commercial or financial relationships that could be construed as a potential conflict of interest.
Figures
Similar articles
-
Characteristics of Cortical Atrophy and White Matter Lesions Between Dementia With Lewy Bodies and Alzheimer's Disease: A Case-Control Study.Front Neurol. 2022 Jan 11;12:779344. doi: 10.3389/fneur.2021.779344. eCollection 2021. Front Neurol. 2022. PMID: 35087466 Free PMC article.
-
Practical cut-offs for visual rating scales of medial temporal, frontal and posterior atrophy in Alzheimer's disease and mild cognitive impairment.J Intern Med. 2015 Sep;278(3):277-90. doi: 10.1111/joim.12358. Epub 2015 Apr 13. J Intern Med. 2015. PMID: 25752192
-
Evaluation of MR Visual Rating Scales in Major Forms of Dementia.J Neurosci Rural Pract. 2021 Jan;12(1):16-23. doi: 10.1055/s-0040-1716806. Epub 2020 Nov 4. J Neurosci Rural Pract. 2021. PMID: 33531755 Free PMC article.
-
Combining visual rating scales to identify prodromal Alzheimer's disease and Alzheimer's disease dementia in a population from a low and middle-income country.Front Neurol. 2022 Sep 1;13:962192. doi: 10.3389/fneur.2022.962192. eCollection 2022. Front Neurol. 2022. PMID: 36119675 Free PMC article.
-
Visual atrophy rating scales and amyloid PET status in an Alzheimer's disease clinical cohort.Ann Clin Transl Neurol. 2023 Apr;10(4):619-631. doi: 10.1002/acn3.51749. Epub 2023 Mar 5. Ann Clin Transl Neurol. 2023. PMID: 36872523 Free PMC article. Review.
Cited by
-
Improvement of brain perfusion in patients with chronic brain ischemia at epidural spinal cord electrical stimulation.Front Surg. 2022 Sep 23;9:1026079. doi: 10.3389/fsurg.2022.1026079. eCollection 2022. Front Surg. 2022. PMID: 36211284 Free PMC article.
-
Association between blood-based protein biomarkers and brain MRI in the Alzheimer's disease continuum: a systematic review.J Neurol. 2024 Nov;271(11):7120-7140. doi: 10.1007/s00415-024-12674-w. Epub 2024 Sep 12. J Neurol. 2024. PMID: 39264441 Free PMC article.
-
Machine learning applications in vascular neuroimaging for the diagnosis and prognosis of cognitive impairment and dementia: a systematic review and meta-analysis.Alzheimers Res Ther. 2025 Aug 7;17(1):183. doi: 10.1186/s13195-025-01815-6. Alzheimers Res Ther. 2025. PMID: 40775365 Free PMC article.
-
Genetic variability of FOXP2 and its targets CNTNAP2 and PRNP in frontotemporal dementia: A pilot study in a southern Italian population.Heliyon. 2024 May 22;10(11):e31624. doi: 10.1016/j.heliyon.2024.e31624. eCollection 2024 Jun 15. Heliyon. 2024. PMID: 38828303 Free PMC article.
-
Genetic variability in ADAM17/TACE is associated with sporadic Alzheimer's disease risk, neuropsychiatric symptoms and cognitive performance on the Rey Auditory Verbal Learning and Clock Drawing Tests.PLoS One. 2025 May 6;20(5):e0309631. doi: 10.1371/journal.pone.0309631. eCollection 2025. PLoS One. 2025. PMID: 40327644 Free PMC article.
References
-
- Avila J., Perry G. (2021). A multilevel view of the development of Alzheimer’s Disease. Neuroscience 457 283–293. - PubMed
LinkOut - more resources
Full Text Sources
Research Materials
Miscellaneous