Using random forest algorithm for glomerular and tubular injury diagnosis
- PMID: 35966858
- PMCID: PMC9366016
- DOI: 10.3389/fmed.2022.911737
Using random forest algorithm for glomerular and tubular injury diagnosis
Abstract
Objectives: Chronic kidney disease (CKD) is a common chronic condition with high incidence and insidious onset. Glomerular injury (GI) and tubular injury (TI) represent early manifestations of CKD and could indicate the risk of its development. In this study, we aimed to classify GI and TI using three machine learning algorithms to promote their early diagnosis and slow the progression of CKD.
Methods: Demographic information, physical examination, blood, and morning urine samples were first collected from 13,550 subjects in 10 counties in Shanxi province for classification of GI and TI. Besides, LASSO regression was employed for feature selection of explanatory variables, and the SMOTE (synthetic minority over-sampling technique) algorithm was used to balance target datasets, i.e., GI and TI. Afterward, Random Forest (RF), Naive Bayes (NB), and logistic regression (LR) were constructed to achieve classification of GI and TI, respectively.
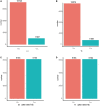
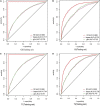
Results: A total of 12,330 participants enrolled in this study, with 20 explanatory variables. The number of patients with GI, and TI were 1,587 (12.8%) and 1,456 (11.8%), respectively. After feature selection by LASSO, 14 and 15 explanatory variables remained in these two datasets. Besides, after SMOTE, the number of patients and normal ones were 6,165, 6,165 for GI, and 6,165, 6,164 for TI, respectively. RF outperformed NB and LR in terms of accuracy (78.14, 80.49%), sensitivity (82.00, 84.60%), specificity (74.29, 76.09%), and AUC (0.868, 0.885) for both GI and TI; the four variables contributing most to the classification of GI and TI represented SBP, DBP, sex, age and age, SBP, FPG, and GHb, respectively.
Conclusion: RF boasts good performance in classifying GI and TI, which allows for early auxiliary diagnosis of GI and TI, thus facilitating to help alleviate the progression of CKD, and enjoying great prospects in clinical practice.
Keywords: auxiliary diagnosis; glomerular injury; machine learning; random forest; tubular injury.
Copyright © 2022 Song, Zhou, Duan, Wang, Li, Li, Zhou, Sun, Qiu, Li and Li.
Conflict of interest statement
The authors declare that the research was conducted in the absence of any commercial or financial relationships that could be construed as a potential conflict of interest.
Figures


Similar articles
-
Machine learning-based warning model for chronic kidney disease in individuals over 40 years old in underprivileged areas, Shanxi Province.Front Med (Lausanne). 2023 Jan 9;9:930541. doi: 10.3389/fmed.2022.930541. eCollection 2022. Front Med (Lausanne). 2023. PMID: 36698845 Free PMC article.
-
[Constructing the Bayesian network models to explore the factors related to glomerular and tubular injury].Zhonghua Yi Xue Za Zhi. 2023 May 16;103(18):1401-1409. doi: 10.3760/cma.j.cn112137-20221101-02279. Zhonghua Yi Xue Za Zhi. 2023. PMID: 37150693 Chinese.
-
Using Sensor Data to Detect Lameness and Mastitis Treatment Events in Dairy Cows: A Comparison of Classification Models.Sensors (Basel). 2020 Jul 10;20(14):3863. doi: 10.3390/s20143863. Sensors (Basel). 2020. PMID: 32664417 Free PMC article.
-
Structure-activity relationship-based chemical classification of highly imbalanced Tox21 datasets.J Cheminform. 2020 Oct 27;12(1):66. doi: 10.1186/s13321-020-00468-x. J Cheminform. 2020. PMID: 33372637 Free PMC article.
-
Stroke Prediction with Machine Learning Methods among Older Chinese.Int J Environ Res Public Health. 2020 Mar 12;17(6):1828. doi: 10.3390/ijerph17061828. Int J Environ Res Public Health. 2020. PMID: 32178250 Free PMC article.
Cited by
-
Using Bayesian networks with Tabu-search algorithm to explore risk factors for hyperhomocysteinemia.Sci Rep. 2023 Jan 28;13(1):1610. doi: 10.1038/s41598-023-28123-z. Sci Rep. 2023. PMID: 36709366 Free PMC article.
-
A Random Forest Algorithm for Assessing Risk Factors Associated With Chronic Kidney Disease: Observational Study.Asian Pac Isl Nurs J. 2024 Jun 3;8:e48378. doi: 10.2196/48378. Asian Pac Isl Nurs J. 2024. PMID: 38830204 Free PMC article.
-
Machine learning-based warning model for chronic kidney disease in individuals over 40 years old in underprivileged areas, Shanxi Province.Front Med (Lausanne). 2023 Jan 9;9:930541. doi: 10.3389/fmed.2022.930541. eCollection 2022. Front Med (Lausanne). 2023. PMID: 36698845 Free PMC article.
-
Gut microbiota landscape and potential biomarker identification in female patients with systemic lupus erythematosus using machine learning.Front Cell Infect Microbiol. 2023 Dec 19;13:1289124. doi: 10.3389/fcimb.2023.1289124. eCollection 2023. Front Cell Infect Microbiol. 2023. PMID: 38169617 Free PMC article.
-
Using elastography-based multilayer perceptron model to evaluate renal fibrosis in chronic kidney disease.Ren Fail. 2023 Dec;45(1):2202755. doi: 10.1080/0886022X.2023.2202755. Ren Fail. 2023. PMID: 37073623 Free PMC article. Clinical Trial.
References
LinkOut - more resources
Full Text Sources

