. 2022 Nov:227:104517.
doi: 10.1016/j.landurbplan.2022.104517. Epub 2022 Jul 26.

Exploring public values through Twitter data associated with urban parks pre- and post- COVID-19

Affiliations

Exploring public values through Twitter data associated with urban parks pre- and post- COVID-19

Jing-Huei Huang et al. Landsc Urban Plan. 2022 Nov.

Abstract

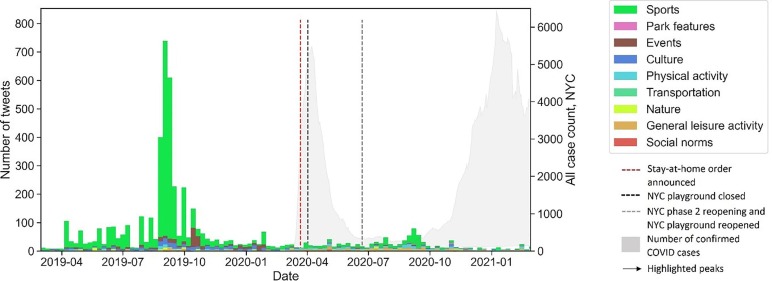
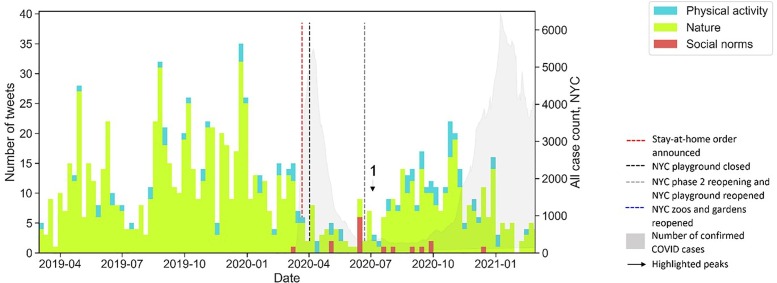
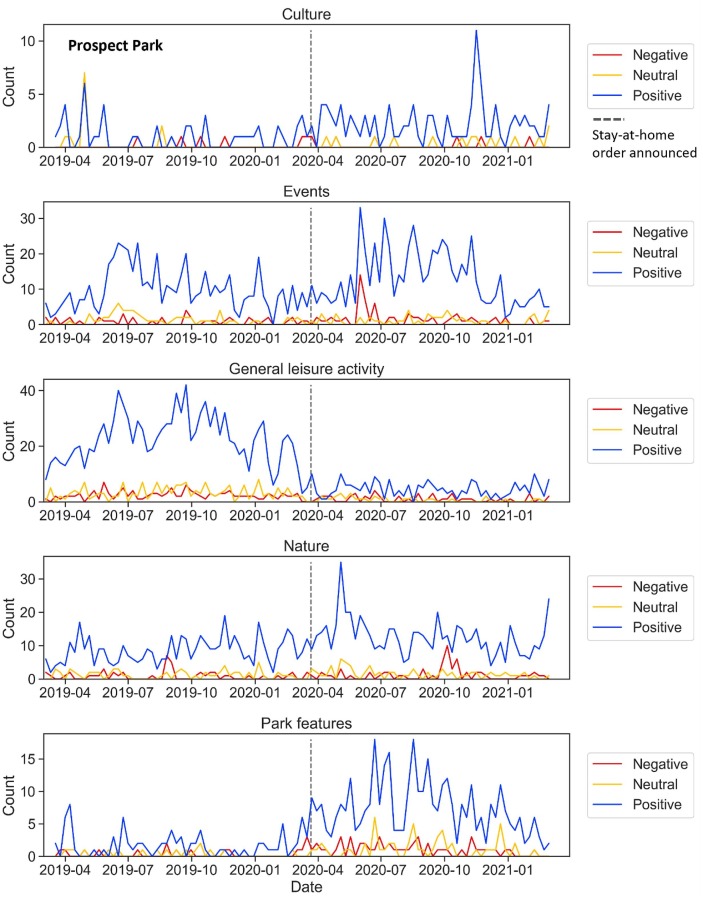
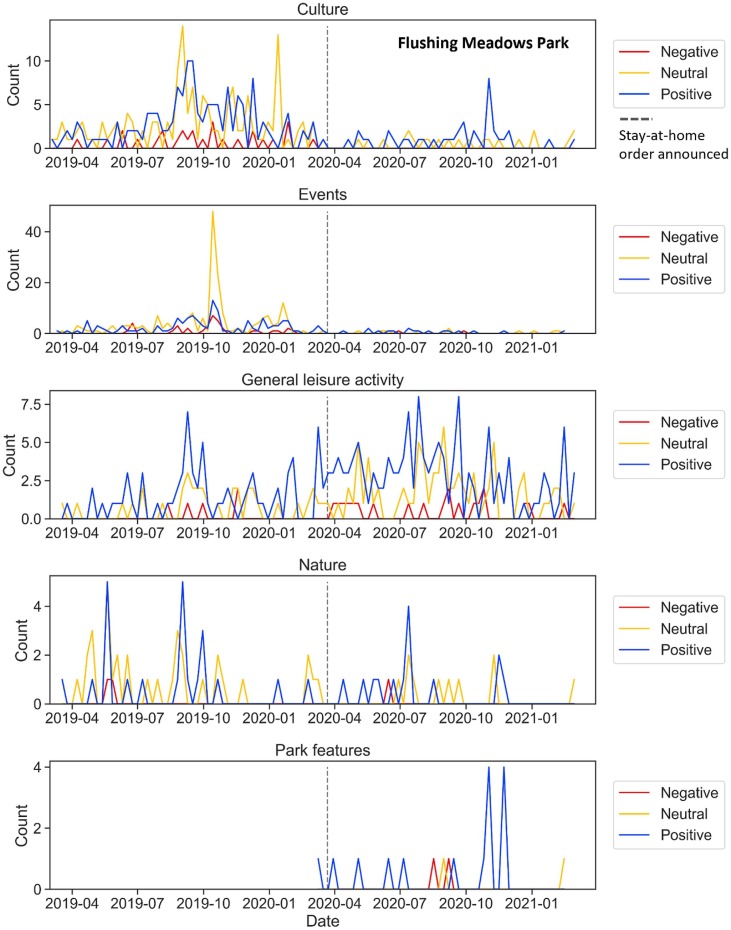
Since school and business closures due to the evolving COVID-19 outbreak, urban parks have been a popular destination, offering spaces for daily fitness activities and an escape from the home environment. There is a need for evidence for parks and recreation departments and agencies to base decisions when adapting policies in response to the rapid change in demand and preferences during the pandemic. The application of social media data analytic techniques permits a qualitative and quantitative big-data approach to gain unobtrusive and prompt insights on how parks are valued. This study investigates how public values associated with NYC parks has shifted between pre- COVID (i.e., from March 2019 to February 2020) and post- COVID (i.e., from March 2020 to February 2021) through a social media microblogging platform -Twitter. A topic modeling technique for short text identified common traits of the changes in Twitter topics regarding impressions and values associated with the parks over two years. While the NYC lockdown resulted in much fewer social activities in parks, some parks continued to be valued for physical activity and nature contact during the pandemic. Concerns about people not keeping physical distance arose in parks where frequent human interactions and crowding seemed to cause a higher probability of the coronavirus transmission. This study demonstrates social media data could be used to capture park values and be specific per park. Results could inform park management during disruptions when use is altered and the needs of the public may be changing.

Keywords: Big data; GSDMM topic modeling; Pandemic; Public values; Social media; Topic modeling; Urban greenspaces.


Conflict of interest statement

The authors declare that they have no known competing financial interests or personal relationships that could have appeared to influence the work reported in this paper.

Figures

Fig. 1
Fig. 1
Data processing procedure. Note. This diagram shows the steps in data processing procedure, which consists of Step 1 (removed invalid tweets for topic detection) and Step 2 (cleaned the tweet contents and transformed the data for analysis).
Fig. 2
Fig. 2
Analysis procedure. Note. This graphic visualizes the steps in the analysis process. An example showcases how the value topics were inductively developed from the topics identified through topic modeling algorithm, followed by a thematic analysis to group the value topics into main themes.
Fig. 3
Fig. 3
Weekly trends of main themes for Central Park-related tweets. Note. This figure displays weekly trends of the nine main themes from tweets about Central Park from March 2019 to February 2021. Peak 1 in late March, Peak 2 in early April, and Peak 3 in May associated with the park features and social norms topics are highlighted.
Fig. 4
Fig. 4
Weekly trends of the sentiments for Central Park topics – park features and social norms. Note. This figure displays the weekly trends of the positive, negative, and neutral sentiments for the social norm and park feature topics associated with Central Park.
Fig. 5
Fig. 5
Weekly trends of main themes in tweets related to Prospect Park. Note. This figure displays weekly trends of the nine main themes from tweets about Prospect Park from March 2019 to February 2021. Peak 1 in March, Peak 2 in May, and Peak 3 in Nov related to the social norms topics are highlighted.
Fig. 6
Fig. 6
Weekly trends in sentiment for Prospect Park topics. Note. This figure displays the weekly trends of the positive, negative, and neutral sentiments for the social norm topic associated with Prospect Park.
Fig. 7
Fig. 7
Weekly trends of main themes in tweets related to Flushing Meadows. Note. This figure displays weekly trends of the nine main themes from tweets about Flushing Meadows from March 2019 to February 2021.
Fig. 8
Fig. 8
Weekly trends of main themes in tweets related to Bronx Park. Note. This figure displays weekly trends of the three main themes from tweets about Bronx Park from March 2019 to February 2021. One peak in June related to a social norm topic is highlighted.
Fig. 9
Fig. 9
Changes in value topics associated with the 4 parks during the pandemic year, compared to the previous year. Note. This figure displays the changes in percentage of tweets associated with each value topic between the year before and the year after the COVID pandemic. The yellow tone color scheme stands for an increase, the blue tone color scheme refers to a decrease, and color white means the value topics are not detected from the tweets. “*” indicates it is a new theme.
Appendix I
Appendix I
Weekly trends in sentiment for Central Park topics.
Appendix I
Appendix I
Weekly trends in sentiment for Central Park topics (continue).
Appendix J
Appendix J
Weekly trends in sentiment for Prospect Park topics.
Appendix J
Appendix J
Weekly trends in sentiment for Prospect Park topics (continue).
Appendix K
Appendix K
Weekly trends in sentiment for Flushing Meadows Park topics.
Appendix K
Appendix K
Weekly trends in sentiment for Flushing Meadows Park topics (continue).
Appendix L
Appendix L
Weekly trends in sentiment for Bronx Park topics.

Similar articles

Cited by

References

    1. Abusaada H., Elshater A. COVID-19’s challenges to urbanism: Social distancing and the phenomenon of boredom in urban spaces. Journal of Urbanism: International Research on Placemaking and Urban Sustainability. 2020;1–3 doi: 10.1080/17549175.2020.1842484. - DOI
    1. Addas A., Maghrabi A. How did the COVID-19 pandemic impact urban green spaces? A multi-scale assessment of Jeddah megacity (Saudi Arabia) Urban Forestry & Urban Greening. 2022;69 doi: 10.1016/j.ufug.2022.127493. - DOI - PMC - PubMed
    1. Alieva D., Holgado D., de Juan S., Ruiz-Frau A., Villasante S., Maya-Jariego I. Assessing landscape features and ecosystem services of marine protected areas through photographs on social media: Comparison of two archipelagos in Spain. Environment, Development and Sustainability. 2021 doi: 10.1007/s10668-021-01841-y. - DOI
    1. Barry S.J. Using social media to discover public values, interests, and perceptions about cattle grazing on park lands. Environmental Management. 2014;53(2):454–464. doi: 10.1007/s00267-013-0216-4. - DOI - PMC - PubMed
    1. Brandwatch. (2018). Brandwatch launches instant social research tool to help marketers reach the right audiences. Retrieved from https://www.brandwatch.com/press/press-releases/brandwatch-launches-inst....

LinkOut - more resources