. 2022 Aug 11;14(1):2110194.
doi: 10.1080/20002297.2022.2110194. eCollection 2022.

Dysbiotic human oral microbiota alters systemic metabolism via modulation of gut microbiota in germ-free mice

Affiliations

Dysbiotic human oral microbiota alters systemic metabolism via modulation of gut microbiota in germ-free mice

Kyoko Yamazaki et al. J Oral Microbiol. .

Abstract

Background: The effect of oral microbiota on the intestinal microbiota has garnered growing attention as a mechanism linking periodontal diseases to systemic diseases. However, the salivary microbiota is diverse and comprises numerous bacteria with a largely similar composition in healthy individuals and periodontitis patients.

Aim: We explored how health-associated and periodontitis-associated salivary microbiota differently colonized the intestine and their subsequent systemic effects.

Methods: The salivary microbiota was collected from a healthy individual and a periodontitis patient and gavaged into C57BL/6NJcl[GF] mice. Gut microbial communities, hepatic gene expression profiles, and serum metabolites were analyzed.

Results: The gut microbial composition was significantly different between periodontitis-associated microbiota-administered (PAO) and health-associated oral microbiota-administered (HAO) mice. The hepatic gene expression profile demonstrated a distinct pattern between the two groups, with higher expression of lipid and glucose metabolism-related genes. Disease-associated metabolites such as 2-hydroxyisobutyric acid and hydroxybenzoic acid were elevated in PAO mice. These metabolites were significantly correlated with characteristic gut microbial taxa in PAO mice. Conversely, health-associated oral microbiota were associated with higher levels of beneficial serum metabolites in HAO mice.

Conclusion: The multi-omics approach used in this study revealed that periodontitis-associated oral microbiota is associated with the induction of disease phenotype when they colonized the gut of germ-free mice.

Keywords: Oral; gut; liver; metabolome; microbiome; transcriptome.


Conflict of interest statement

No potential conflict of interest was reported by the author(s).

Figures

Figure 1.
Figure 1.
Oral gavage of periodontitis-associated oral microbiota and health-associated oral microbiota have distinct effects on liver and adipose tissue histology. (A) Hematoxylin and eosin staining of the liver (scale bars, 100 μm) of periodontitis-associated oral microbiota-administered (PAO) and health-associated oral microbiota-administered (HAO) mice. (B) Epididymal adipose tissues of PAO and HAO mice stained with a rat anti-mouse F4/80 primary antibody. Representative images (HAO #1 and PAO #1, respectively) of three HAO and four PAO mice.
Figure 2.
Figure 2.
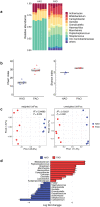
Comparative analysis of microbial composition in feces between periodontitis-associated oral microbiota-administered (PAO) and health-associated oral microbiota-administered (HAO) mice (n = 6/group). (A) Relative abundance of microbial groups at the genus level in the PAO and HAO mice. (B) Alpha diversity for Chao1 richness and Shannon diversity index of each experimental group. (C) Principal coordinate analysis score plot of the gut microbiota profiles of each experimental group using weighted and unweighted UniFrac distances. (D) Significantly different taxa as determined by ANCOM-BC at the genus level.
Figure 3.
Figure 3.
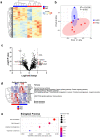
Gene expression profile in the liver of periodontitis-associated oral microbiota-administered (PAO) and health-associated oral microbiota-administered (HAO) mice (n = 6/group). (A) Hierarchical clustering heatmap of differentially expressed genes in the gut. Differentially expressed genes (DEGs) are listed along the Y-axis in the order that they clustered, as indicated by the colored line along the Y-axis. Each column contains expression values for an individual animal with groups indicated along the X-axis and clustering indicated by the dendrogram above the figure. (B) Principal coordinate analysis based on Bray-Curtis dissimilarity of the PAO and HAO mice gene expression profile. (C) Volcano plot of DEGs. The red dots represent up and down regulation according to the difference in expression (fold change of > 2) and significance (P < 0.05) in PAO mice compared with HAO mice. (D) Heatmap of the DEGs identified by volcano plot. (E) Gene set enrichment analysis of KEGG pathways. The size of the dots corresponds to the number of genes in the reference gene set. The color of the dots corresponds to the adjusted P-value.
Figure 4.
Figure 4.
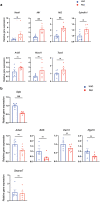
Relative mRNA expression of the differentially expressed genes (DEGs) by volcano plot analysis (n = 6/group). (A) Quantitative real-time polymerase chain reaction (qPCR) quantification of mRNA levels of genes expressed higher in the liver of periodontitis-associated oral microbiota-administered (PAO) mice. (B) qPCR quantification of mRNA levels of genes expressed higher in the liver of health-associated oral microbiota-administered (HAO) mice. Data are expressed as mean ± SEM; * P < 0.05, ** P < 0.005; Mann–Whitney U-test.
Figure 5.
Figure 5.
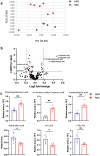
Oral gavage of periodontitis-associated oral microbiota and health-associated oral microbiota have distinct effects on serum metabolomic profile (n = 6/group). (A) Principal component analysis (PCA) of serum metabolites from periodontitis-associated oral microbiota-administered (PAO) and health-associated oral microbiota-administered (HAO) mice. (B) Volcano plot showing individual metabolites of PAO and HAO mice. Red plots represent significantly different metabolites (fold change of > 1.5 and P < 0.05). (C) Pairwise comparisons of significantly changed metabolites between PAO and HAO mice. Data were expressed as mean relative area ± SEM; * P < 0.05, ** P < 0.01, Mann–Whitney U-test. (D) Heatmap showing the correlation expression between 30 differential metabolites and the amplicon sequence variants. The correlation analyses were based on the Spearman correlation coefficient test. * P < 0.05, ** P < 0.01, *** P < 0.001.
Figure 5.
Figure 5.
(continued).

Similar articles

Cited by

References

    1. Qin N, Yang F, Li A, et al. Alterations of the human gut microbiome in liver cirrhosis. Nature. 2014;513(7516):59–14. Epub 2014/08/01. PubMed PMID: 25079328 - PubMed
    1. Read E, Curtis MA, Neves JF.. The role of oral bacteria in inflammatory bowel disease.Nat Rev Gastroenterol Hepatol.2021;18(10):731–742;Epub 2021/08/18. PubMed PMID: 34400822; - PubMed
    1. Yachida S, Mizutani S, Shiroma H, et al. Metagenomic and metabolomic analyses reveal distinct stage-specific phenotypes of the gut microbiota in colorectal cancer. Nat Med. 2019;25(6):968–976. Epub 2019/06/07. PubMed PMID: 31171880 - PubMed
    1. Schmidt TS, Hayward MR, Coelho LP, et al. Extensive transmission of microbes along the gastrointestinal tract. Elife. Epub 2019/02/13. 10.7554/eLife.42693. PubMed PMID: 30747106; PubMed Central PMCID: PMCPMC6424576. 2019;8 - DOI - PMC - PubMed
    1. Kageyama S, Takeshita T, Asakawa M, et al. Relative abundance of total subgingival plaque-specific bacteria in salivary microbiota reflects the overall periodontal condition in patients with periodontitis. PLoS One. 2017;12(4):e0174782. Epub 2017/04/04. PubMed PMID: 28369125; PubMed Central PMCID: PMCPMC5378373 - PMC - PubMed