. 2022 Jul 27;7(31):27664-27673.
doi: 10.1021/acsomega.2c03326. eCollection 2022 Aug 9.

Elucidating Sensitivity and Stability Relationship of Gold-Carbon Hybrid LSPR Sensors Using Principal Component Analysis

Affiliations

Elucidating Sensitivity and Stability Relationship of Gold-Carbon Hybrid LSPR Sensors Using Principal Component Analysis

Nikhil Bhalla et al. ACS Omega. .

Abstract

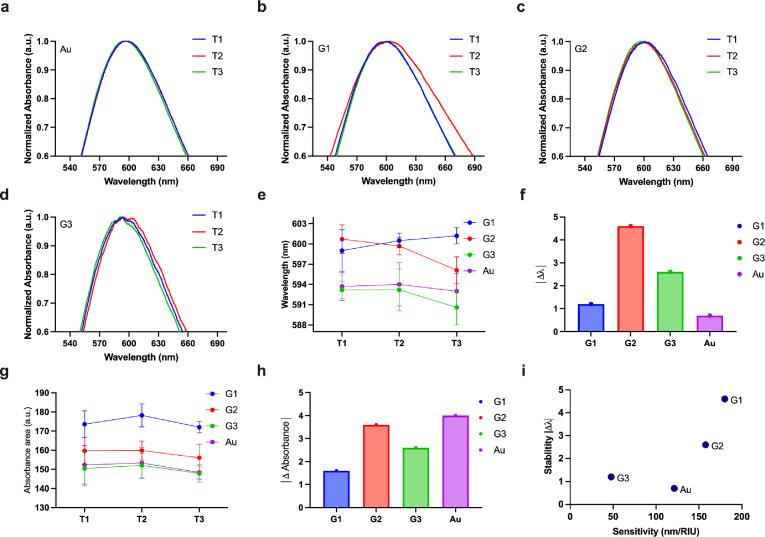
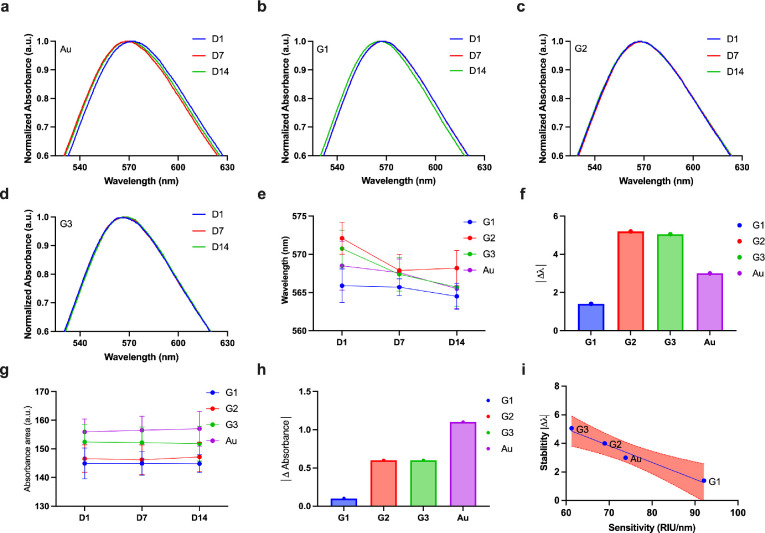
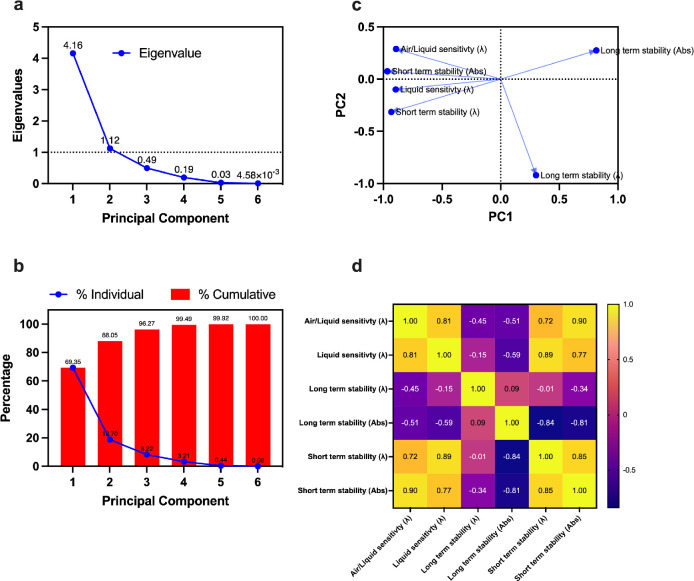
Sensitive localized surface plasmon resonance (LSPR) sensing is achieved using nanostructured geometries of noble metals which typically have dimensions less than 100 nm. Among the plethora of geometries and materials, the spherical geometries of gold (Au) are widely used to develop sensitive bio/chemical sensors due to ease of manufacturing and biofunctionlization. One major limitation of spherical-shaped geometries of Au, used for LSPR sensing, is their low refractive index (RI) sensitivity which is commonly addressed by adding another material to the Au nanostructures. However, the process of addition of new material on Au nanostructures, while retaining the LSPR of Au, often comes with a trade-off which is associated with the instability of the developed composite, especially in harsh chemical environments. Addressing this challenge, we develop a Au-graphene-layered hybrid (Au-G) with high stability (studied up to 2 weeks here) and enhanced RI sensitivity (a maximum of 180.1 nm/RIU) for generic LSPR sensing applications using spherical Au nanostructures in harsh chemical environments, involving organic solvents. Additionally, by virtue of principal component analysis, we correlate stability and sensitivity of the developed system. The relationship suggests that the shelf life of the material is proportional to its sensitivity, while the stability of the sensor during the measurement in liquid environment decreases when the sensitivity of the material is increased. Though we uncover this relationship for the LSPR sensor, it remains evasive to explore similar relationships within other optical and electrochemical transduction techniques. Therefore, our work serves as a benchmark report in understanding/establishing new correlations between sensing parameters.


Conflict of interest statement

The authors declare no competing financial interest.

Figures

Figure 1
Figure 1
SEM and EDX: scanning electron microscopy images for the Au chip (a,b), G1 (d,e), G2 (g,h), and G3 (j,k). EDX analysis for the Au, G1, G2, and G3 samples is shown in figure (c), (f), (i), and (l), respectively. The subfigures in c, f, i, and l correspond to the (i) Au EDX map, (ii) C EDX map, (iii) SEM image, and (iv) EDX spectrum relating to the map. Note: Au refers to the Au nanoisland substrate and G1, G2, and G3 conventions are used for the graphene-AuNP hybrid with an average of 10 layers of graphene, the graphene-AuNP hybrid with an average of 20 layers of graphene, and the graphene oxide-AuNP hybrid with an average of 10 layers of graphene oxide, respectively.
Figure 2
Figure 2
Transmission electron microscopy: low (top row) and high resolution (middle and bottom row) transmission electron images for (a–c) G1, (d–f) G2, and (g–i) G3 graphitic samples. Note: Au refers to Au nanoisland substrate, and G1, G2, and G3 conventions are used for the graphene-AuNP hybrid with an average of 10 layers of graphene, the graphene-AuNP hybrid with an average of 20 layers of graphene, and the graphene oxide-AuNP hybrid with an average of 10 layers of graphene oxide, respectively.
Figure 3
Figure 3
LSPR characterization: (a) Normalized absorbance vs wavelength of Au, G1, G2, and G3 showing LSPR peaks. (b) Tukey’s multiple comparisons test with alpha value = 0.05 performed on the absorbance change for Au, G1, G2, and G3. The number of stars indicate the degree of significance (the more the number of stars, the more significant the data). The LSPR responses of (c) Au, (d) G1, (e) G2, and (f) G3 are shown in various chemical environments. Note: Au refers to the Au nanoisland substrate and G1, G2, and G3 conventions are used for the graphene-AuNP hybrid with an average of 10 layers of graphene, the graphene-AuNP hybrid with an average of 20 layers of graphene, and the graphene oxide-AuNP hybrid with an average of 10 layers of graphene oxide, respectively.
Figure 4
Figure 4
Refractive index sensitivity analysis: (a) refractive index vs wavelength plot for Au, G1, G2, and G3 in air/liquid environment. (b) Refractive index vs wavelength plot for Au, G1, G2, and G3 in a liquid only environment. Panels (c, d) show multiple comparison tests on Au, G1, G2, and G3 performed using Tukey’s test on refractive index sensitivities obtained for experiments conducted in the air/liquid environment and liquid-only environment, respectively. Note: Au refers to Au nanoisland substrate and G1, G2, and G3 conventions are used for the graphene-AuNP hybrid with an average of 10 layers of graphene, the graphene-AuNP hybrid with an average of 20 layers of graphene, and the graphene oxide-AuNP hybrid with an average of 10 layers of graphene oxide, respectively.
Figure 5
Figure 5
Short-term stability analysis. (a–d) Normalized absorbance vs wavelength plot for Au, G1, G2, and G3, respectively, at time periods T1, T2, and T3. (e) Wavelength changes at time T1, T2, and T3 for Au, G1, G2, and G3. (f) Wavelength change between T1 and T3 for Au, G1, G2, and G3. (g) Absorbance changes at time T1, T2, and T3 for Au, G1, G2, and G3. (h) Absorbance change between T1 and T3 for Au, G1, G2, and G3. (i) Sensitivity vs stability plot for Au, G1, G2, and G3. Note that T1 = 20 min, T2 = 40 min, and T3 = 60 min. Note: Au refers to Au nanoisland substrate, and G1, G2, and G3 conventions are used for the graphene-AuNP hybrid with an average of 10 layers of graphene, the graphene-AuNP hybrid with an average of 20 layers of graphene, and the graphene oxide-AuNP hybrid with an average of 10 layers of graphene oxide, respectively. The subfigures (a–d) are representative spectrum corresponding to the experimental conditions which yield shifts within the standard deviations shown in (e) and (g) subfigures.
Figure 6
Figure 6
Long-term stability analysis: (a–d) Normalized absorbance vs wavelength plot for Au, G1, G2, and G3, respectively, on D1, D7, and D14. (e) Wavelength changes on D1, D7, and D14 for Au, G1, G2, and G3. (f) Wavelength change between D1 and D14 for Au, G1, G2, and G3. (g) Absorbance changes on D1, D7, and D14 for Au, G1, G2, and G3. (h) Absorbance change between D1 and D14 for Au, G1, G2, and G3. (i) Sensitivity vs stability plot for Au, G1, G2, and G3. Note that D1 is day 1, D7 is day 7, and D14 is day 14. Note: Au refers to the Au nanoisland substrate and G1, G2, and G3 conventions are used for the graphene-AuNP hybrid with an average of 10 layers of graphene, the graphene-AuNP hybrid with an average of 20 layers of graphene, and the graphene oxide-AuNP hybrid with an average of 10 layers of graphene oxide, respectively. The shaded area within (i) represents the confidence interval of 95% for the line fitted using linear regression with a R2value of 0.98. The subfigures (a–d) are representative spectrum corresponding to the experimental conditions which yield shifts within the standard deviations shown in (e and g) subfigures.
Figure 7
Figure 7
Stability vs sensitivity PCA. Panel (a) shows eigenvalues of all principal components. Panel (b) demonstrates the contribution of each principal component toward the variance in the given data. The principal components 1 and 2 account for more than 88.05% variance, and therefore, PC1 and PC2 are selected to show the loading plot in panel (c); Panel (d) shows a matrix showing Pearson correlation (r) between all variables used within PCA.

Similar articles

References

    1. Hammond J. L.; Bhalla N.; Rafiee S. D.; Estrela P. Localized surface plasmon resonance as a biosensing platform for developing countries. Biosensors 2014, 4, 172–188. 10.3390/bios4020172. - DOI - PMC - PubMed
    1. Ronkainen N. J.; Halsall H. B.; Heineman W. R. Electrochemical biosensors. Chem. Soc. Rev. 2010, 39, 1747–1763. 10.1039/b714449k. - DOI - PubMed
    1. Qin J.; Wang W.; Gao L.; Yao S. Emerging Biosensing and Transducing Techniques for Potential Applications in Point-of-Care Diagnostics. Chem. Sci. 2022, 13, 2857.10.1039/D1SC06269G. - DOI - PMC - PubMed
    1. Zhao J.; Zhang X.; Yonzon C. R.; Haes A. J.; van Duyne R. P. Localized surface plasmon resonance biosensors. Nanomedicine 2006, 1, 219–228. 10.2217/17435889.1.2.219. - DOI - PubMed
    1. Willets K. A.; Van Duyne R. P. Localized surface plasmon resonance spectroscopy and sensing. Annu. Rev. Phys. Chem. 2007, 58, 267–297. 10.1146/annurev.physchem.58.032806.104607. - DOI - PubMed