. 2022 May 30;7(8):1850-1865.
doi: 10.1016/j.ekir.2022.05.027. eCollection 2022 Aug.

The Independent Effects of Procurement Biopsy Findings on 10-Year Outcomes of Extended Criteria Donor Kidney Transplants

Affiliations

The Independent Effects of Procurement Biopsy Findings on 10-Year Outcomes of Extended Criteria Donor Kidney Transplants

Darren E Stewart et al. Kidney Int Rep. .

Abstract

Introduction: The role of procurement biopsies in deceased donor kidney evaluation is debated in light of uncertainty about the influence of biopsy findings on recipient outcomes. The literature is filled with conflicting and ambiguous findings typically derived from small studies focused on short-term outcomes or reliant on biopsies prepared by methods impractical in the time-sensitive context of organ procurement.

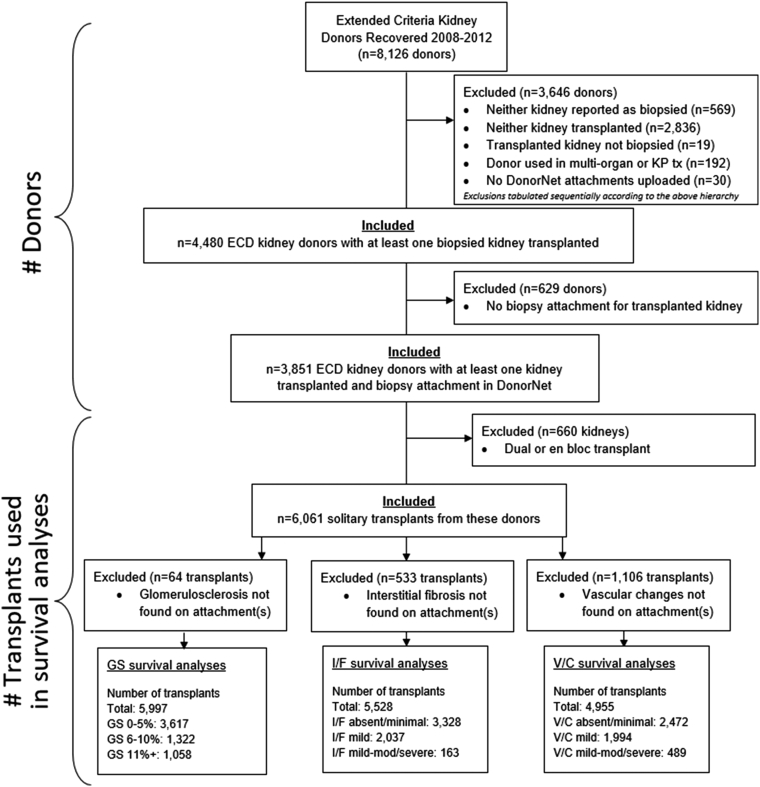
Methods: After manual data entry of DonorNet attachments from 4480 extended criteria donors (ECDs) recovered in the United States from 2008 to 2012, we applied causal inference methods in a Cox regression framework to estimate independent effects of glomerulosclerosis (GS), interstitial fibrosis, and vascular changes on long-term kidney graft survival. Kidney discard rates from 2018 to 2019 were evaluated to characterize contemporary kidney utilization patterns.

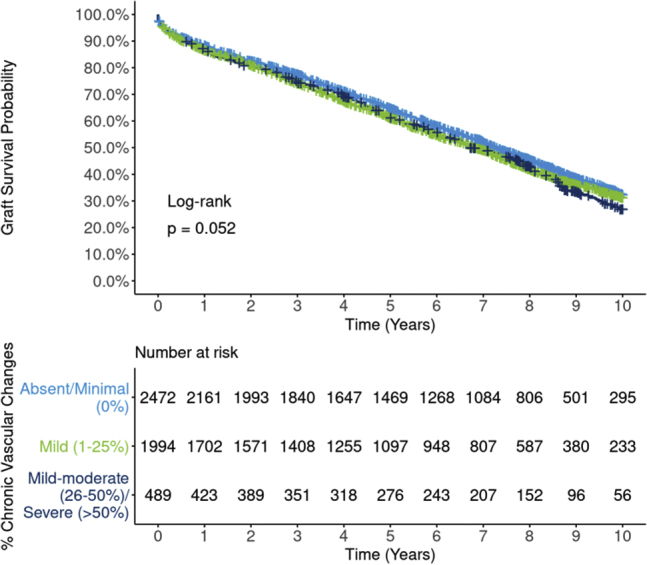
Results: Effects of interstitial fibrosis and vascular changes were largely attenuated after adjusting for potentially confounding donor and recipient variables, although conclusions are less certain for severe levels due to smaller sample sizes. By contrast, significant effects of GS (>10% vs. 0%-5%) persisted even after adjustment (all-cause, hazard ratio [HR] 1.18; 95% CI 1.06, 1.28; death-censored, HR 1.28; 95% CI 1.08, 1.46) but plateaued beyond 10%. By contrast, kidney discard rates increased precipitously as GS rose >10%.

Conclusion: Despite being obtained under less than ideal conditions, estimated GS from a procurement biopsy is independently associated with long-term graft survival, above and beyond standard clinical parameters, in ECD transplants. However, the disproportionately high likelihood of discard for kidneys with GS >10% is unjustified. The outsized effect of GS on kidney utilization should be tempered and commensurate with its effect on outcomes.

Keywords: Kidney Donor Profile Index; biopsy; extended criteria donor; glomerulosclerosis; graft survival; kidney transplantation.


Figures

None
Graphical abstract
Figure 1
Figure 1
BARETO study survival analysis cohort derivation CONSORT diagram. Cohort selection flow diagram for biopsy, anatomy, and resistance effects on transplant outcomes observational study using the CONSORT format. #, number; CONSORT, Consolidated Standards of Reporting Trials; ECD, extended criteria donor; GS, glomerulosclerosis; I/F, interstitial fibrosis; KP, kidney-pancreas; tx, transplant; V/C, vascular changes.
Figure 2
Figure 2
Ten-year, Kaplan-Meier all-cause graft survival by GS (3 levels: 0%–5%, 6%–10%, 11%+). Estimated graft survival rates for 5997 extended criteria donor kidney transplants occurring between 2008 and 2012 are illustrated by 3 levels of GSs. Survival curves are statistically different between the 3 groups (P < 0.0001), with the GS 0% to 5% group having superior unadjusted graft survival compared with 6% to 10% and 11%+ groups. The survival curves suggest a dose-response relationship, where graft survival declines as GS increases. GS, glomerulosclerosis.
Figure 3
Figure 3
The unadjusted and adjusted associations between 3-level GS and 10-year, all-cause graft failure risk. The figure illustrates all-cause graft failure hazard ratios and 95% CIs comparing 3 levels of GS using the following 4 different analyses: unadjusted Cox regression (top left panel), propensity weighted Cox regression (top right), standard multivariable regression (bottom left), and doubly robust regression (DRR; bottom right). In unadjusted analysis, the risk of graft failure was 29% higher with GS 11%+ compared with the reference group, GS 0% to 5%. All 3 risk adjusted methods reveal that though GS effect was tempered after adjusting for correlations with donor and recipient factors, a statistically and clinical significant effect of GS persisted. In DRR analysis, the graft failure hazard ratio for GS 11%+ (vs. 0%–5%) was 1.18 (1.07, 1.28). DRR, doubly robust regression; GS, glomerulosclerosis.
Figure 4
Figure 4
The associations between continuous GS and 10-year, all-cause graft failure risk, modeled as a nonlinear function. The figure illustrates the estimated relationship between GS along a continuum from 0% to 30%, as modeled by nonlinear splines using the following 4 analytical approaches: unadjusted Cox regression (top left panel), propensity weighted Cox regression (top right), standard multivariable regression (bottom left), and doubly robust regression (DRR; bottom right). Though all 3 risk adjusted methods revealed that the GS effect was somewhat attenuated after adjusting for correlations with donor and recipient factors, a statistically and clinical significant effect of GS persisted. The relationship between GS and graft failure risk is clearly nonlinear, with a steep effect between 0% and approximately 10%, followed by a plateauing effect beyond 10%. CIs (found in gray) indicate that the apparent declining risk for higher GS is not statistically significant. DRR, doubly robust regression; GS, glomerulosclerosis.
Figure 5
Figure 5
The discordant relationship between GS, all-cause graft survival, and kidney discard. The figure illustrates the estimated, nonlinear relationship between GS and 10-year graft failure risk, based on extended criteria donor transplants from 2008 to 2012. Kidney discard rates among ECD donors by GS category are superimposed using a second vertical axis. To provide a meaningful comparison, both analyses are unadjusted. The steep relationship between kidney discard rates for GS beyond 10% stands in sharp relief juxtaposed against the tapered relationship between GS and graft failure risk. CIs are found in blue. ECD, extended criteria donor; GS, glomerulosclerosis.
Figure 6
Figure 6
Ten-year, all-cause Kaplan-Meier graft survival by interstitial fibrosis. Estimated graft survival rates for 5528 extended criteria donor kidney transplants occurring between 2008 and 2012 are found by 3 levels of interstitial fibrosis. Differences between survival curves are of borderline statistical significance (P = 0.052), with the “absent/minimal” group having slightly superior unadjusted graft survival compared with the other groups. The survival curve for “mild-moderate/severe” transplants stands out to some degree as lower than the other groups but is based on a comparatively modest sample size.
Figure 7
Figure 7
The unadjusted and adjusted associations between interstitial fibrosis and 10-year, all-cause graft failure risk. The figure illustrates all-cause graft failure hazard ratios and 95% CIs comparing 3 levels of interstitial fibrosis using the following 4 different analyses: unadjusted Cox regression (top left panel), propensity weighted Cox regression (top right), standard multivariable regression (bottom left), and doubly robust regression (DRR; bottom right). In unadjusted analysis, the risk of graft failure was 21% higher with “mild-moderate/severe” interstitial fibrosis compared with the reference group, “absent/minimal.” However, apparent effect of interstitial fibrosis was greatly tempered after adjusting for correlations with donor and recipient factors. In DRR analysis, the graft failure hazard ratio for “mild-moderate/severe” (vs. “absent/minimal”) was 1.13 (0.83–1.39). DRR, doubly robust regression.
Figure 8
Figure 8
Ten-year Kaplan-Meier, all-cause graft survival by vascular changes. Estimated graft survival rates for 4995 extended criteria donor kidney transplants occurring between 2008 and 2012 are illustrated by 3 levels of vascular changes. Differences between survival curves are of borderline statistical significance (P = 0.052), with the “absent/minimal” group having slightly superior unadjusted graft survival compared with the other groups.
Figure 9
Figure 9
The unadjusted and adjusted associations between vascular changes and 10-year, all-cause graft failure risk. The figure illustrates all-cause graft failure hazard ratios and 95% CIs comparing 3 levels of vascular changes using the following 4 different analyses: unadjusted Cox regression (top left panel), propensity weighted Cox regression (top right), standard multivariable regression (bottom left), doubly robust regression (DRR; bottom right). In unadjusted analysis, the risk of graft failure was 12% higher with “mild-moderate/severe” vascular changes compared with the reference group, “absent/minimal.” However, apparent effect of vascular changes was greatly attenuated after adjusting for correlations with donor and recipient factors. In DRR analysis, the graft failure hazard ratio for “mild-moderate/severe” (vs. “absent/minimal”) was 1.06 (0.90–1.26). DRR, doubly robust regression.

References

    1. Lentine K.L., Kasiske B., Axelrod D.A. Procurement biopsies in kidney transplantation: more information may not lead to better decisions. J Am Soc Nephrol. 2021;32:1835–1837. doi: 10.1681/ASN.2021030403. - DOI - PMC - PubMed
    1. Reese P.P., Aubert O., Naesens M., et al. Assessment of the utility of kidney histology as a basis for discarding organs in the United States: a comparison of international transplant practices and outcomes. J Am Soc Nephrol. 2021;32:397–409. doi: 10.1681/ASN.2020040464. - DOI - PMC - PubMed
    1. Carpenter D., Husain S.A., Brennan C., et al. Procurement biopsies in the evaluation of deceased donor kidneys. Clin J Am Soc Nephrol. 2018;13:1876–1885. doi: 10.2215/CJN.04150418. - DOI - PMC - PubMed
    1. Naesens M. Zero-time renal transplant biopsies: a comprehensive review. Transplantation. 2016;100:1425–1439. doi: 10.1097/TP.0000000000001018. - DOI - PubMed
    1. Muruve N.A., Steinbecker K.M., Luger A.M. Are wedge biopsies of cadaveric kidneys obtained at procurement reliable? Transplantation. 2000;69:2384–2388. doi: 10.1097/00007890-200006150-00029. - DOI - PubMed

LinkOut - more resources