

Modeling infectious disease dynamics: Integrating contact tracing-based stochastic compartment and spatio-temporal risk models
- PMID: 35967269
- PMCID: PMC9361636
- DOI: 10.1016/j.spasta.2022.100691
Modeling infectious disease dynamics: Integrating contact tracing-based stochastic compartment and spatio-temporal risk models
Abstract
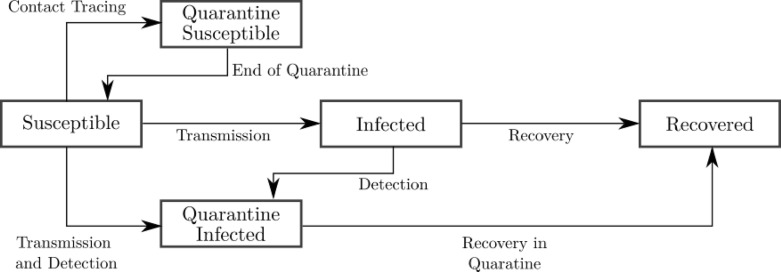
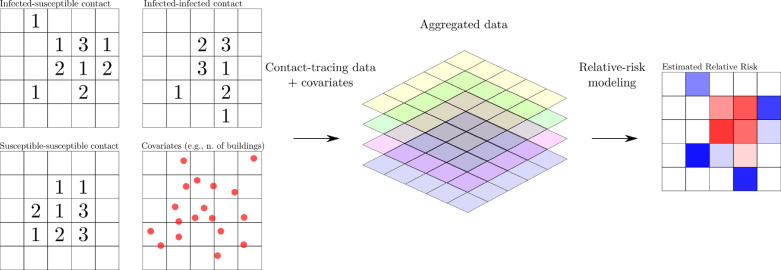
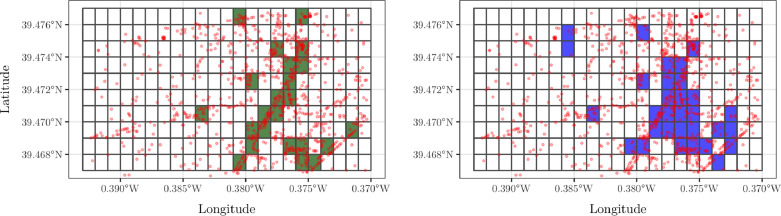
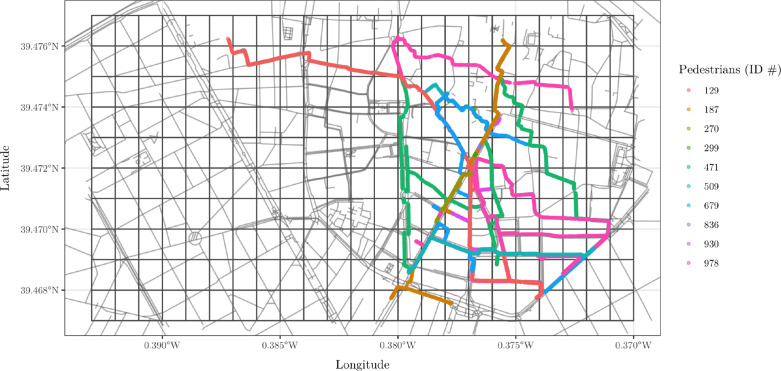
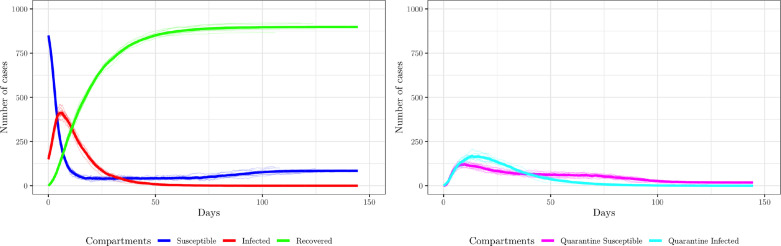
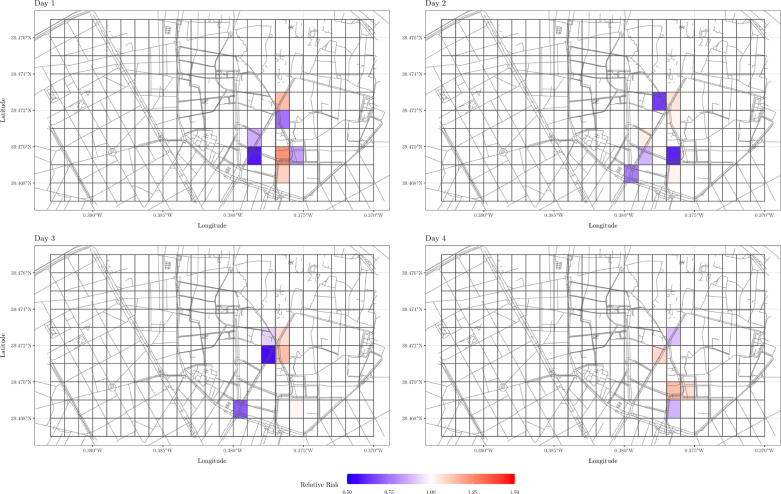
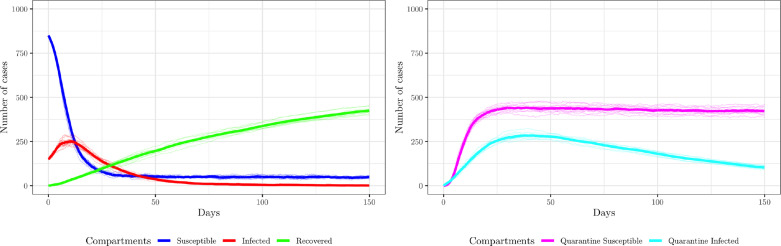
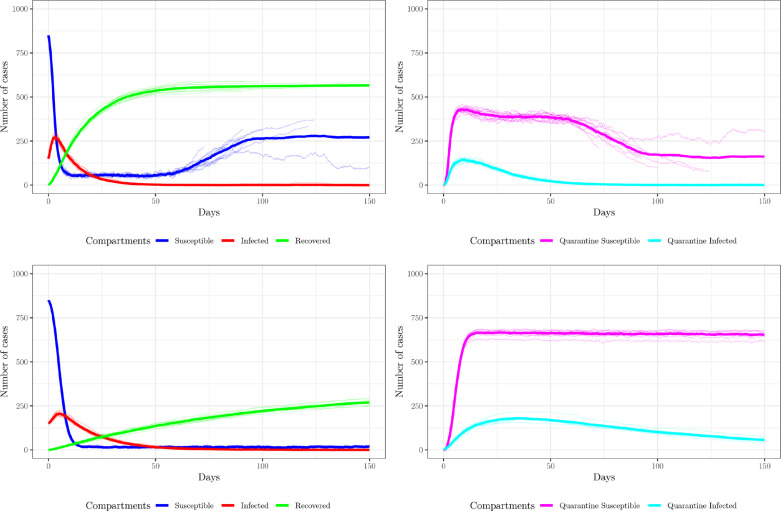
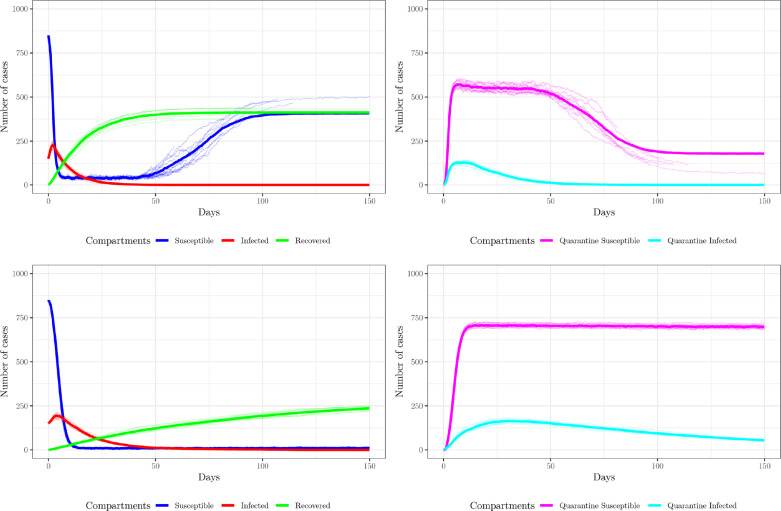
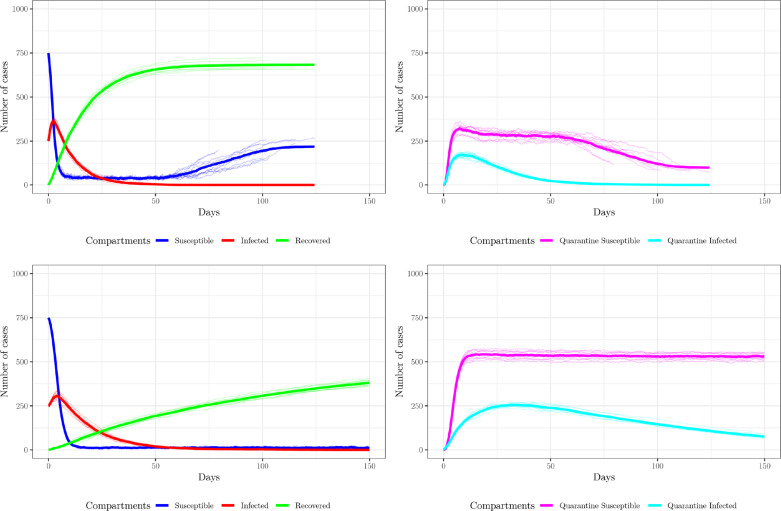
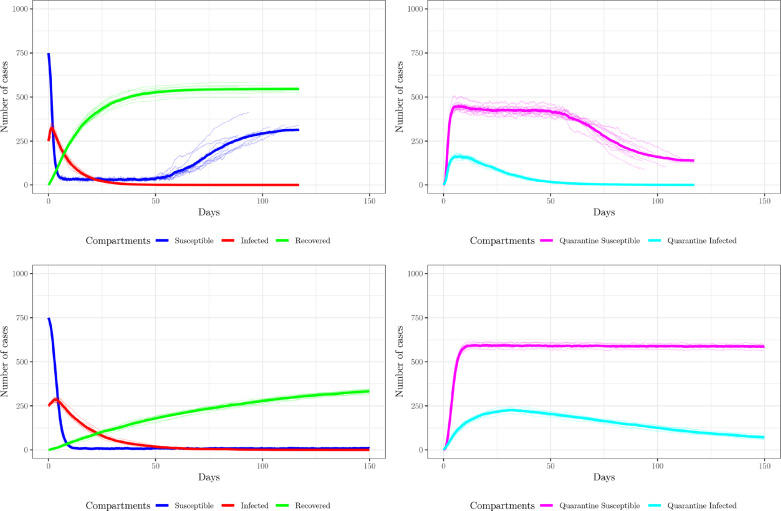
Major infectious diseases such as COVID-19 have a significant impact on population lives and put enormous pressure on healthcare systems globally. Strong interventions, such as lockdowns and social distancing measures, imposed to prevent these diseases from spreading, may also negatively impact society, leading to jobs losses, mental health problems, and increased inequalities, making crucial the prioritization of riskier areas when applying these protocols. The modeling of mobility data derived from contact-tracing data can be used to forecast infectious trajectories and help design strategies for prevention and control. In this work, we propose a new spatial-stochastic model that allows us to characterize the temporally varying spatial risk better than existing methods. We demonstrate the use of the proposed model by simulating an epidemic in the city of Valencia, Spain, and comparing it with a contact tracing-based stochastic compartment reference model. The results show that, by accounting for the spatial risk values in the model, the peak of infected individuals, as well as the overall number of infected cases, are reduced. Therefore, adding a spatial risk component into compartment models may give finer control over the epidemic dynamics, which might help the people in charge to make better decisions.
Keywords: Compartment modeling; Contact tracing; Infectious diseases; Pedestrian mobility; Spatio-temporal modeling.
© 2022 Elsevier B.V. All rights reserved.
Figures


Similar articles
-
Spatio-temporal modeling of infectious diseases by integrating compartment and point process models.Stoch Environ Res Risk Assess. 2023;37(4):1519-1533. doi: 10.1007/s00477-022-02354-4. Epub 2022 Dec 13. Stoch Environ Res Risk Assess. 2023. PMID: 36530377 Free PMC article.
-
Contextual contact tracing based on stochastic compartment modeling and spatial risk assessment.Stoch Environ Res Risk Assess. 2022;36(3):893-917. doi: 10.1007/s00477-021-02065-2. Epub 2021 Oct 26. Stoch Environ Res Risk Assess. 2022. PMID: 34720737 Free PMC article.
-
Contribution of Testing Strategies and Contact Tracing towards COVID-19 Outbreaks Control: A Mathematical Modeling Study.Trop Med Infect Dis. 2022 Nov 14;7(11):376. doi: 10.3390/tropicalmed7110376. Trop Med Infect Dis. 2022. PMID: 36422926 Free PMC article.
-
COVID-19 Spread in Saudi Arabia: Modeling, Simulation and Analysis.Int J Environ Res Public Health. 2020 Oct 23;17(21):7744. doi: 10.3390/ijerph17217744. Int J Environ Res Public Health. 2020. PMID: 33113936 Free PMC article.
-
Remote sensing and geographic information systems in the spatial temporal dynamics modeling of infectious diseases.Sci China C Life Sci. 2006 Dec;49(6):573-82. doi: 10.1007/s11427-006-2015-0. Sci China C Life Sci. 2006. PMID: 17312996 Free PMC article. Review.
Cited by
-
Exploration of the COVID-19 pandemic at the neighborhood level in an intra-urban setting.Front Public Health. 2023 Apr 13;11:1128452. doi: 10.3389/fpubh.2023.1128452. eCollection 2023. Front Public Health. 2023. PMID: 37124802 Free PMC article.
References
-
- Banerjee Sudipto, Carlin Bradley P., Gelfand Alan E. Chapman and Hall/CRC; 2003. Hierarchical Modeling and Analysis for Spatial Data.
-
- Besag Julian, York Jeremy, Mollié Annie. Bayesian image restoration, with two applications in spatial statistics. Ann. Inst. Statist. Math. 1991;43(1):1–20.
LinkOut - more resources
Full Text Sources