. 2022 Jul 29:13:938075.
doi: 10.3389/fimmu.2022.938075. eCollection 2022.

Single-cell RNA-Seq reveals changes in immune landscape in post-traumatic osteoarthritis

Affiliations

Single-cell RNA-Seq reveals changes in immune landscape in post-traumatic osteoarthritis

Aimy Sebastian et al. Front Immunol. .

Abstract

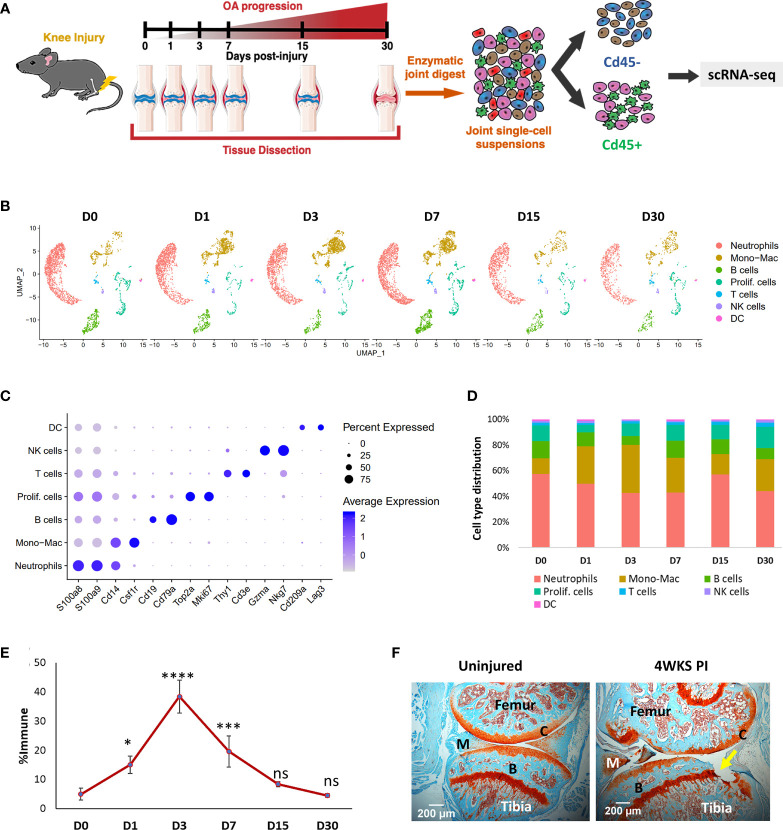
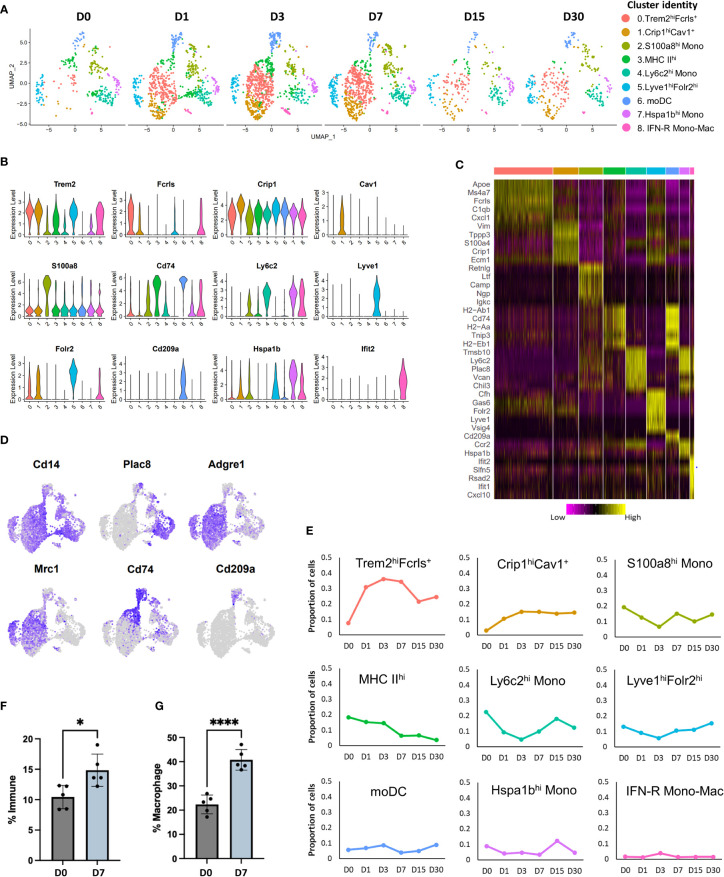
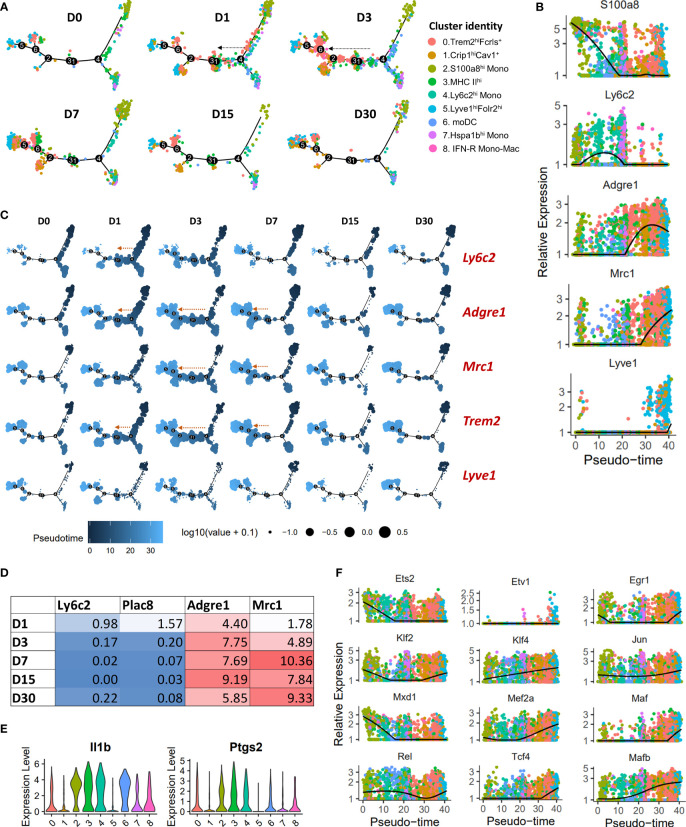
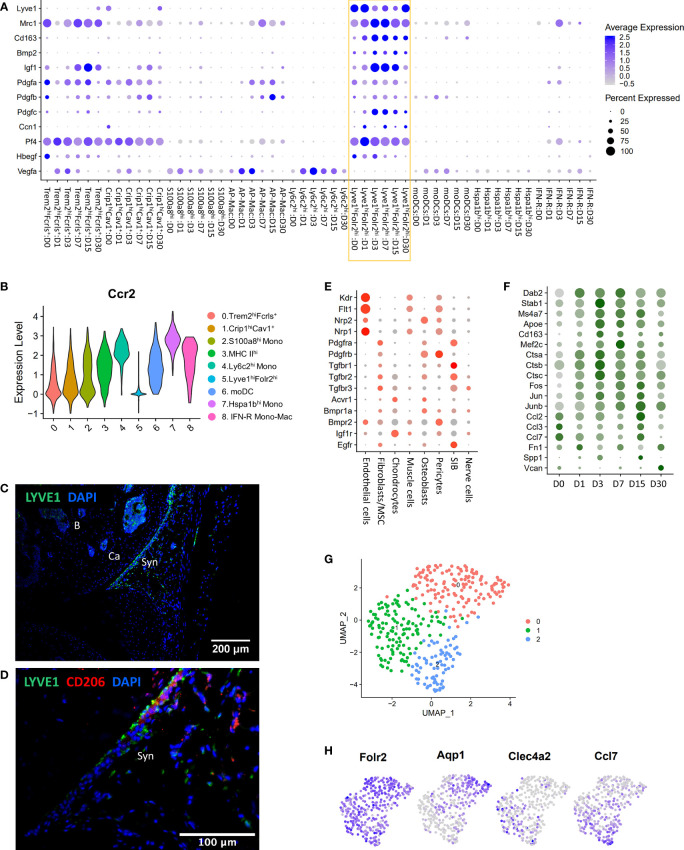
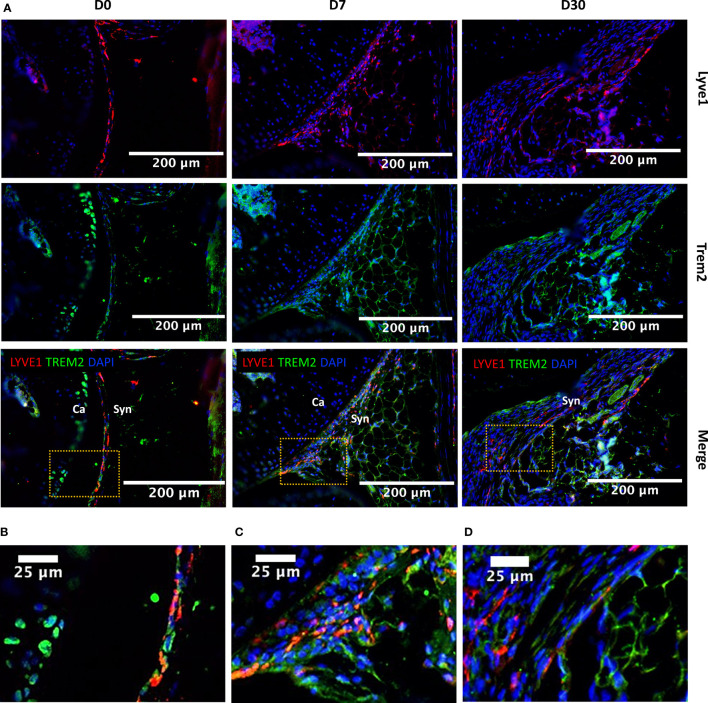
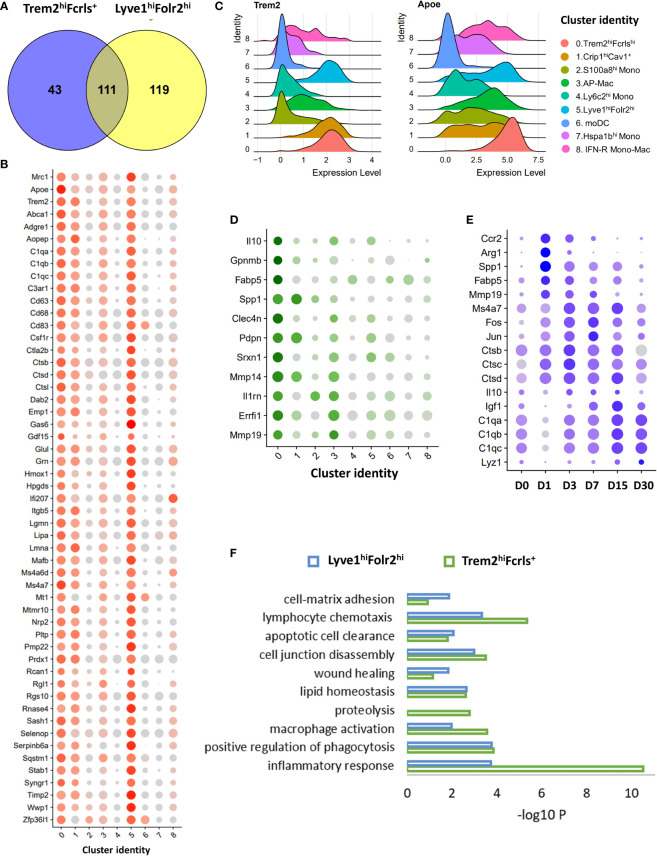
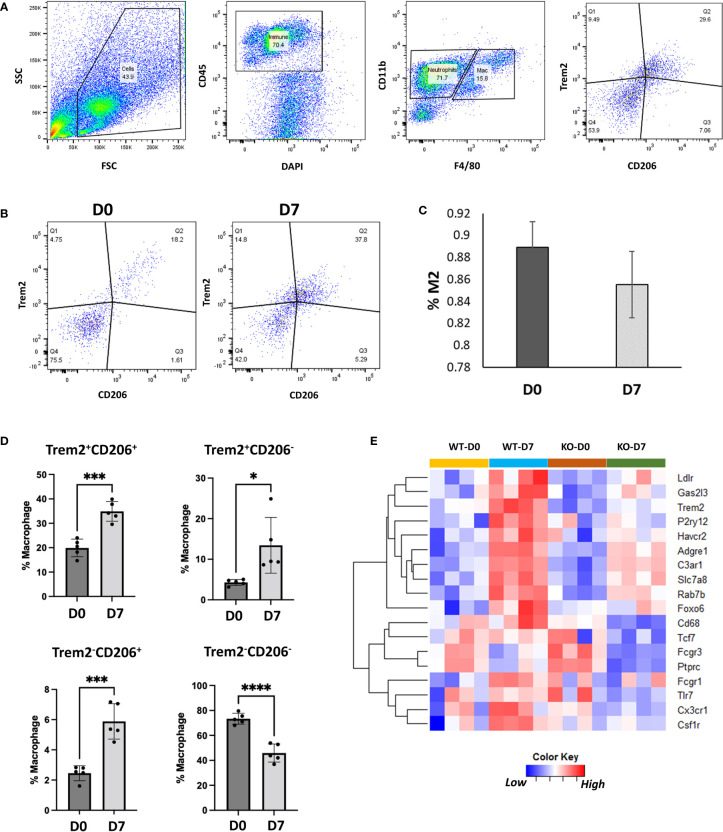
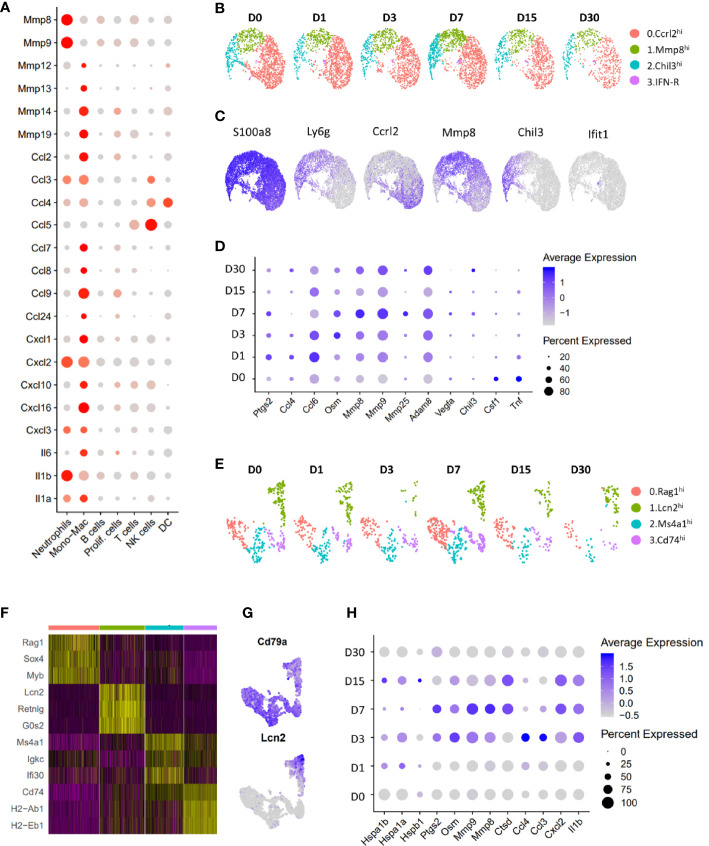
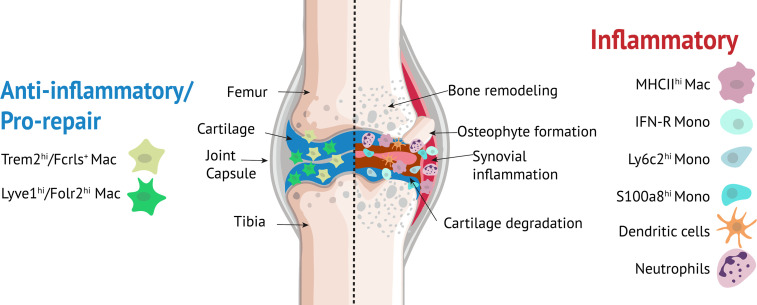
Osteoarthritis (OA) is the most common joint disease, affecting over 300 million people world-wide. Accumulating evidence attests to the important roles of the immune system in OA pathogenesis. Understanding the role of various immune cells in joint degeneration or joint repair after injury is vital for improving therapeutic strategies for treating OA. Post-traumatic osteoarthritis (PTOA) develops in ~50% of individuals who have experienced an articular trauma like an anterior cruciate ligament (ACL) rupture. Here, using the high resolution of single-cell RNA sequencing, we delineated the temporal dynamics of immune cell accumulation in the mouse knee joint after ACL rupture. Our study identified multiple immune cell types in the joint including neutrophils, monocytes, macrophages, B cells, T cells, NK cells and dendritic cells. Monocytes and macrophage populations showed the most dramatic changes after injury. Further characterization of monocytes and macrophages reveled 9 major subtypes with unique transcriptomics signatures, including a tissue resident Lyve1hiFolr2hi macrophage population and Trem2hiFcrls+ recruited macrophages, both showing enrichment for phagocytic genes and growth factors such as Igf1, Pdgfa and Pdgfc. We also identified several genes induced or repressed after ACL injury in a cell type-specific manner. This study provides new insight into PTOA-associated changes in the immune microenvironment and highlights macrophage subtypes that may play a role in joint repair after injury.

Keywords: Trem2; immune cells; inflammation; knee injury; macrophages; osteoarthritis; ptoa; scRNA-seq.


Conflict of interest statement

The authors declare that the research was conducted in the absence of any commercial or financial relationships that could be construed as a potential conflict of interest.

Figures

Figure 1
Figure 1
Single-cell analysis of injury-induced immune changes in 10-week-old BL6 mouse knee joints. (A) Graphical representation of the experimental workflow. Uninjured (D0) and injured (D1, D3, D7, D15 and D30) knee joints were dissected, dissociated into single cells and immune and non-immune fractions were sequenced separately using scRNA-seq. (B) Cell clusters from scRNA-seq analysis visualized by Uniform Manifold Approximation and Projection (UMAP). Colors indicate clusters of various cell types. (C) Dot plot showing the expression of selected markers of various cell types. Dot size represents the fraction of cells expressing a specific marker while the intensity of color indicates the average expression level for each gene. (D) Changes in the proportion of various immune cell types in the joint over time. scRNA-seq analysis showed a dramatic increase in Mono-Macs after injury, which peaked at D3. (E) Flow cytometry analysis of injury-induced changes in monocytes/macrophage population. Compared to D0, there was a significant increase in CD45+CD11b+Ly6C+Ly6G- monocytes/macrophages in the knee joints after injury. Data is represented as mean ± standard deviation (SD). *p<0.01; ***p<0.0001; ****p<0.000001; ns, not significant (one-way ANOVA and Tukey’s post hoc test). (F) Safranin-O histological stained sections of uninjured and 4-weeks post-injury joints (4WKS PI). Arrow indicates cartilage damage observed at 4WKS PI. C, cartilage; B, bone; M, meniscus. 5× magnification; scale bars = 200μm.
Figure 2
Figure 2
Characterization of injury-induced changes in monocyte/macrophage populations. (A) UMAP plots of nine monocyte and macrophage subtypes identified in mouse knee joints at various timepoints. (B) Violin plots showing the expression of selected markers of various monocyte and macrophage sub-populations (colored based on cluster identities in panel (A). (C) Heatmap showing the scaled expression of top genes enriched in each monocyte/macrophage cluster. (D) Feature plots showing the expression of key monocyte and macrophage markers in various clusters. (E) Changes in the proportion of various monocyte and macrophage populations after injury, determined using scRNA-seq (colored based on cluster identities in panel (A). (F) Flow cytometry analysis of macrophages (CD45+CD11b+F4/80+) in uninjured (D0) and injured (D7) joints. Injured joints at D7 had significantly more macrophages than D0. Data is represented as mean ± SD. *p ≤ 0.05 (two-sided unpaired t-test). (G) Flow cytometry data showing the proportion of M2-like (CD45+CD11b+F4/80+ CD206+) macrophages at D0 and D7, relative to all macrophages. D7 joints showed a significantly higher proportion of M2-like macrophages compared to D0 joints. Data is represented as mean ± SD. ****p ≤ 0.0001 (two-sided unpaired t-test).
Figure 3
Figure 3
Pseudo-time differentiation trajectory analysis of monocytes and macrophages from D0-D30. (A) The relative position of cells across the pseudo-time differentiation trajectory is depicted. Each point is a cell and is colored according to its cluster identity. Cells along the trajectory were divided into six groupings based on experimental timepoints (D0-D30). An expansion of Trem2hiFcrls+ population in monocytes → macrophage direction was observed after injury, primarily at D1 and D3 (indicated by arrows). (B) Expression of monocyte and macrophage markers on a pseudo-time scale (each point represents a cell and is colored based on cluster identities in panel (A)). Monocyte markers were highly expressed at the beginning of the differentiation trajectory while Mrc1 and Lyve1 had the highest expression towards the end. (C) Superimposition of the expression of selected genes on the pseudo-time trajectory. Each point is a cell and is colored according to its pseudo-time value. Circle size represents the gene expression level. Expansion of cell populations expressing high levels of Adgre1, Trem2 and Mrc1 in the monocyte → macrophage direction was observed after injury (indicated by arrows). (D) Average expression of monocyte and macrophage markers in Trem2hiFcrlshi cluster. (E) Violin plots showing elevated Il1b and Ptgs2 expression in MHC IIhi macrophages (cluster 3). MHC IIhi macrophages and monocytes/moDCs expressed higher levels of Il1b and Ptgs2 compared to other macrophage clusters, including Trem2hiFcrls+ and Lyve1+ macrophages. (F) Plots showing pseudo-time-ordered expression of selected transcription factors (cells are colored based on cluster identities in panel (A)).
Figure 4
Figure 4
Characterization of Lyve1hiFolr2hi macrophages. (A) Dot plot showing enrichment of growth factors in Lyve1hiFolr2hi macrophages (yellow box). Dot size represents the fraction of cells expressing a specific gene while the intensity of color indicates the average expression level for each gene. (B) Violin plot showing the expression of Ccr2 in various monocyte/macrophage subtypes. Lyve1+ macrophages showed significantly lower Ccr2 expression. (C) IHC analysis of Lyve1+ macrophages at D0 (10× magnification; scale bar = 200μm). Lyve1+ macrophages were primarily present at the synovial lining at D0. B: bone; Ca: cartilage; Syn: synovium. (D) Co-expression of Lyve1 and CD206 at the synovial lining at D0 (40× magnification; scale bar = 100μm). (E) Growth factor receptor expression in connective tissue-forming cells from the joint. Dot size represents the fraction of cells expressing each gene (grey: low expression; red: high expression). (F) Genes upregulated in Lyve1hiFolr2hi macrophages after injury. Dot size represents the fraction of cells expressing each gene (grey: low expression; green: high expression). (G) UMAP plot showing 3 subtypes of Lyve1hiFolr2hi macrophages. (H) Feature plots showing the expression of Folr2 and markers of various subtypes of Lyve1hiFolr2hi macrophages.
Figure 5
Figure 5
Injury-induced changes in the localization of Lyve1hiFolr2hi macrophages based on Lyve1 expression. (A) IHC showing Lyve1 and Trem2 expression in macrophages at D0, D7 and D30 (20× magnification; scale bar = 200μm), and a closer view of the images for (B) D0, (C) D7 and (D) D30 matching to the highlighted boxes in A (scale bar = 25μm). The Lyve1+ macrophages were primarily observed at the synovial lining at D0. The lining of Lyve1+ macrophages was disrupted after injury and these cells started to infiltrate the synovial membrane. Ca, cartilage; Syn, synovium.
Figure 6
Figure 6
Characterization of Trem2hi M2-like macrophages using scRNA-seq. (A) Venn diagrams showing the overlap between genes enriched in both Trem2hiFcrls+ and Lyve1hiFolr2himacrophages compared to all other clusters. (B) Dot plot showing the expression of a subset of genes enriched in both Trem2hiFcrls+ and Lyve1hiFolr2himacrophages. Dot size represents the fraction of cells expressing each gene (grey: low expression; red: high expression). (C) Ridge plot showing the expression of Trem2 and its ligand Apoe in various clusters. Both Trem2 and Apoe were enriched in Trem2hiFcrls+ and Lyve1hiFolr2hi macrophages. (D) Dot plot showing the expression of a subset of genes enriched in Trem2hiFcrls+ macrophages compared to Lyve1hiFolr2hi macrophages. Dot size represents the fraction of cells expressing each gene (grey: low expression; green: high expression) (E) Genes upregulated in Trem2hiFcrls+ macrophages after injury. Dot size represents the fraction of cells expressing each gene (grey: low expression; blue: high expression). (F) Ontology terms associated with genes enriched in Trem2hiFcrls+ and Lyve1hiFolr2himacrophages compared to other clusters.
Figure 7
Figure 7
Characterization of Trem2-expressing macrophages using flow cytometry. (A) Flow cytometry gating strategy to identify Trem2-expressing M2-like macrophages. (B) Flow cytometry plots showing Trem2+ M2-like macrophages at D0 and D7. (C) Proportion of Trem2+ macrophages among M2-like macrophages at D0 and D7. Data is represented as mean ± SD. (D) Proportion of Trem2 and CD206- expressing macrophages relative to all macrophages. Data is represented as mean ± SD. *p ≤ 0.05; ***p ≤ 0.001; ****p ≤ 0.0001 (two-sided unpaired t-test). (E) Genes differentially expressed between injured joints of wildtype (WT) and Trem2-/- (KO) mice at D7.
Figure 8
Figure 8
Characterization of neutrophils and B lymphocytes. (A) Dot plot showing the expression of cytokines and proteases in various immune cell clusters. Dot size represents the fraction of cells expressing a specific marker while the intensity of color indicates the average expression level for each gene (grey: low expression; red: high expression). (B) UMAP plot showing various neutrophil sub-clusters. (C) Feature plot showing the expression of various neutrophil sub-cluster markers as well as pan-neutrophil marker S100a8. (D) Dot plot showing genes differentially expressed in neutrophils after injury. Dot size represents the fraction of cells expressing a specific marker while the intensity of color indicates the average expression level for each gene. (E) UMAP plot showing various B cell sub-clusters. (F) Heatmap showing genes enriched in each B cell subtype. (G) Feature plot showing the expression of Lcn2 and B cell marker Cd79a in B cell subtypes. (H) Genes differentially expressed in Lcn2hi B cell-like cells after injury. Dot size represents the fraction of cells expressing a specific marker while the intensity of color indicates the average expression level for each gene.
Figure 9
Figure 9
Myeloid cells in the knee joint. Lyve1hiFolr2hi and Trem2hiFcrls+ macrophages play an anti-inflammatory/pro-repair role while monocytes, moDCs, MHC IIhi macrophages and neutrophils may have pro-inflammatory roles.

References

    1. de Rezende MU, de Campos GC. Is osteoarthritis a mechanical or inflammatory disease? Rev Bras Ortop (2013) 48(6):471–4. doi: 10.1016/j.rbe.2013.12.002 - DOI - PMC - PubMed
    1. Lin YJ, Anzaghe M, Schulke S. Update on the pathomechanism, diagnosis, and treatment options for rheumatoid arthritis. Cells (2020) 9(4):880. doi: 10.3390/cells9040880 - DOI - PMC - PubMed
    1. Woodell-May JE, Sommerfeld SD. Role of inflammation and the immune system in the progression of osteoarthritis. J Orthop Res (2020) 38(2):253–7. doi: 10.1002/jor.24457 - DOI - PubMed
    1. Robinson WH, Lepus CM, Wang Q, Raghu H, Mao R, Lindstrom TM, et al. . Low-grade inflammation as a key mediator of the pathogenesis of osteoarthritis. Nat Rev Rheumatol (2016) 12(10):580–92. doi: 10.1038/nrrheum.2016.136 - DOI - PMC - PubMed
    1. Chow YY, Chin KY. The role of inflammation in the pathogenesis of osteoarthritis. Mediators Inflamm (2020) 2020:8293921. doi: 10.1155/2020/8293921 - DOI - PMC - PubMed

Publication types