

FoxP3+ CD8 T-cells in acute HIV infection and following early antiretroviral therapy initiation
- PMID: 35967314
- PMCID: PMC9372390
- DOI: 10.3389/fimmu.2022.962912
FoxP3+ CD8 T-cells in acute HIV infection and following early antiretroviral therapy initiation
Abstract
Objectives: Besides CD4 regulatory T-cells (Tregs), immunosuppressor FoxP3+ CD8 T-cells are emerging as an important subset of Tregs, which contribute to immune dysfunction and disease progression in HIV infection. However, FoxP3+ CD8 T-cell dynamics in acute HIV infection and following early antiretroviral therapy (ART) initiation remain understudied.
Methods: Subsets of FoxP3+ CD8 T-cells were characterized both prospectively and cross-sectionally in PBMCs from untreated acute (n=26) and chronic (n=10) HIV-infected individuals, early ART-treated in acute infection (n=10, median of ART initiation: 5.5 months post-infection), ART-treated in chronic infection (n=10), elite controllers (n=18), and HIV-uninfected controls (n=21).
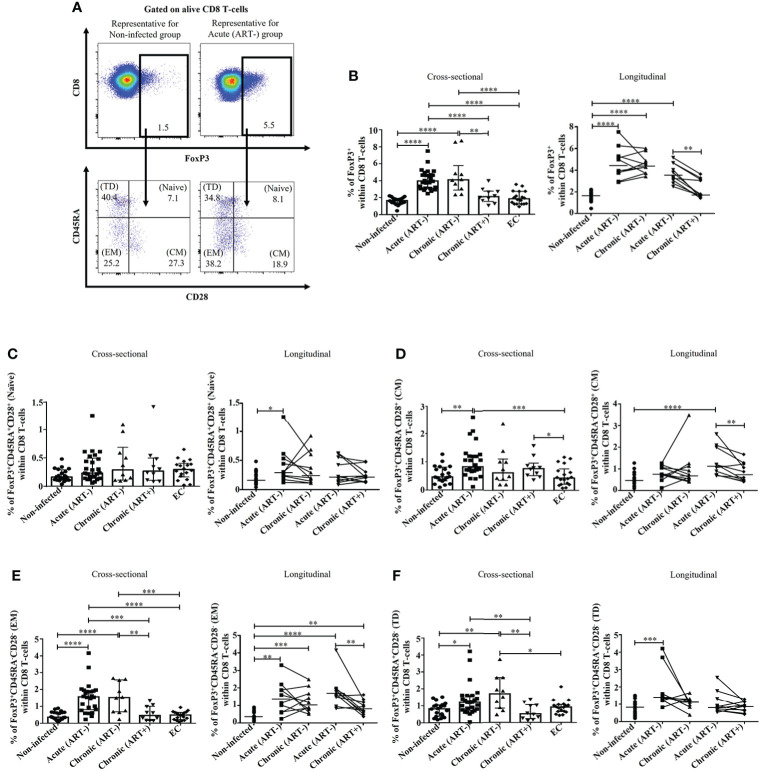
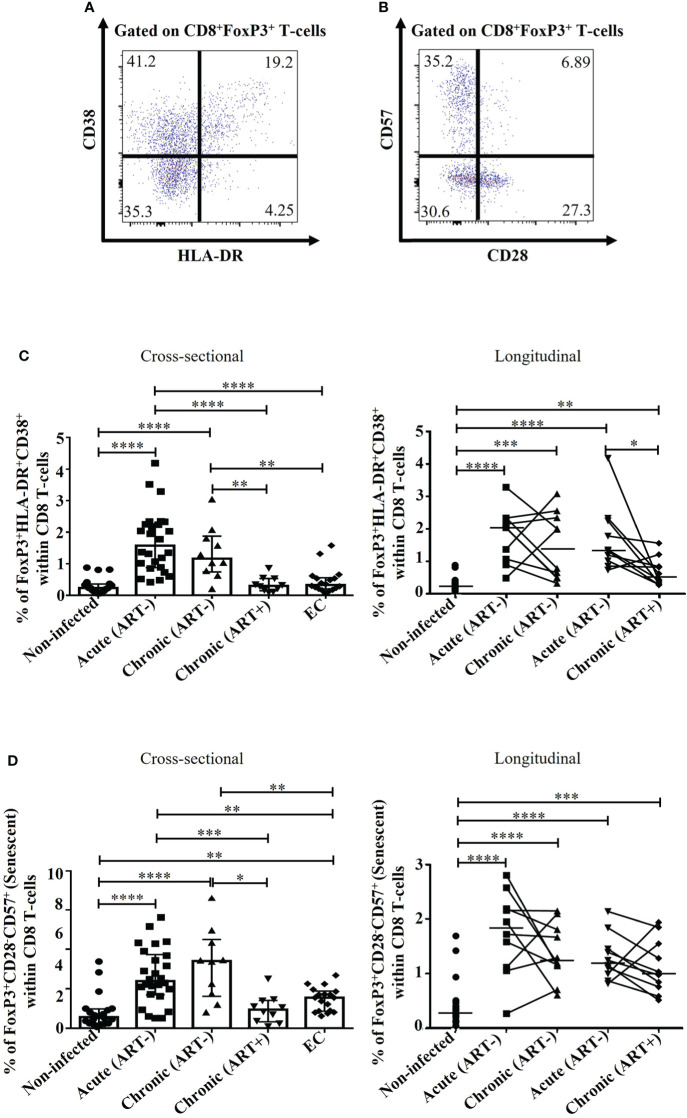
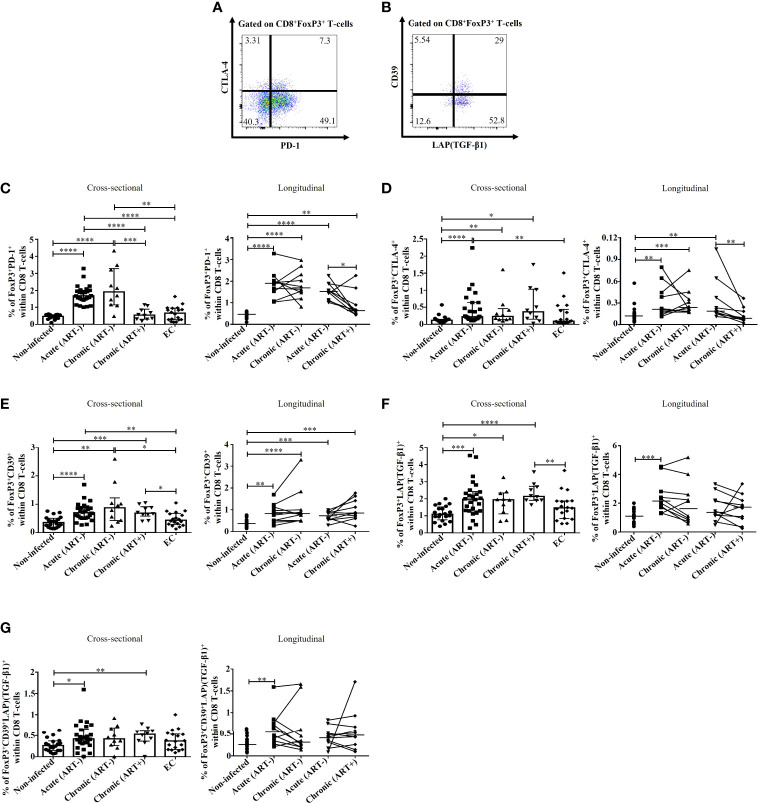
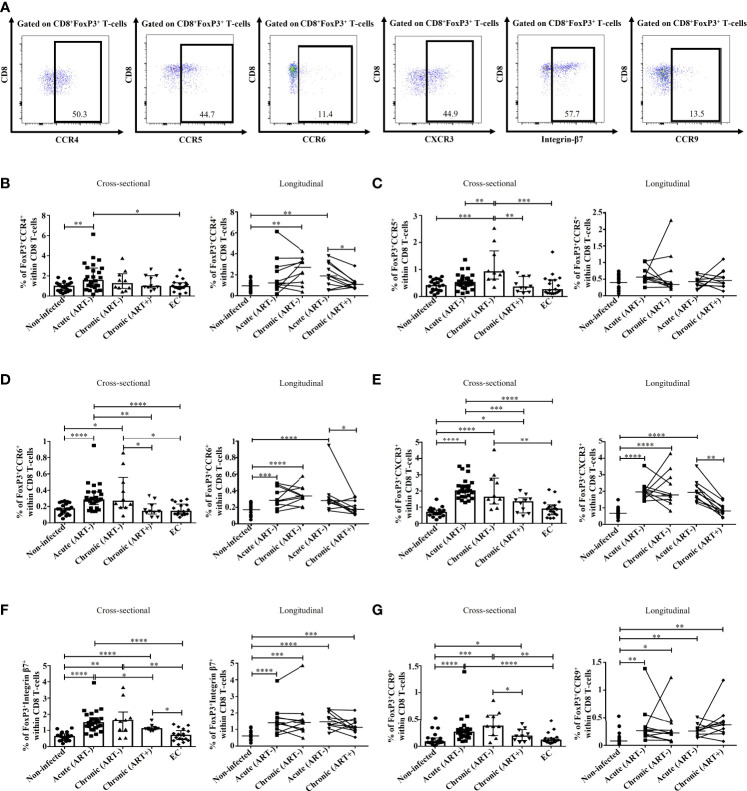
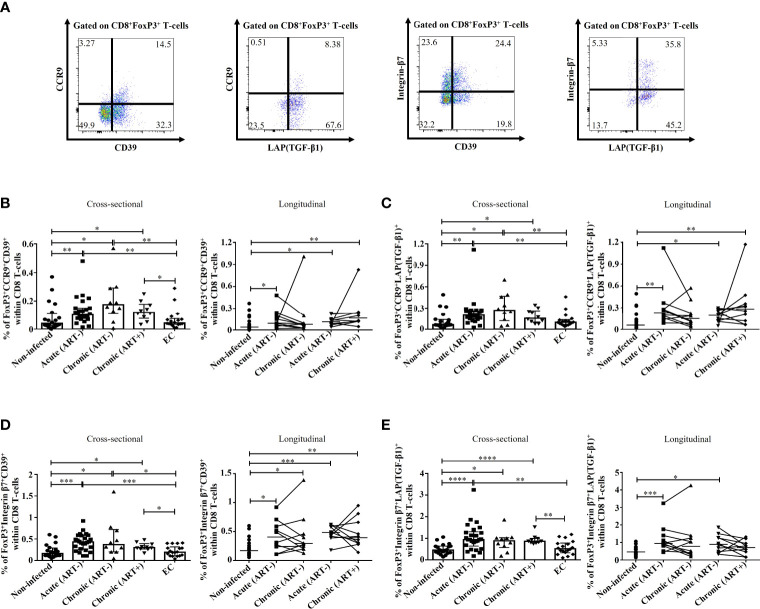
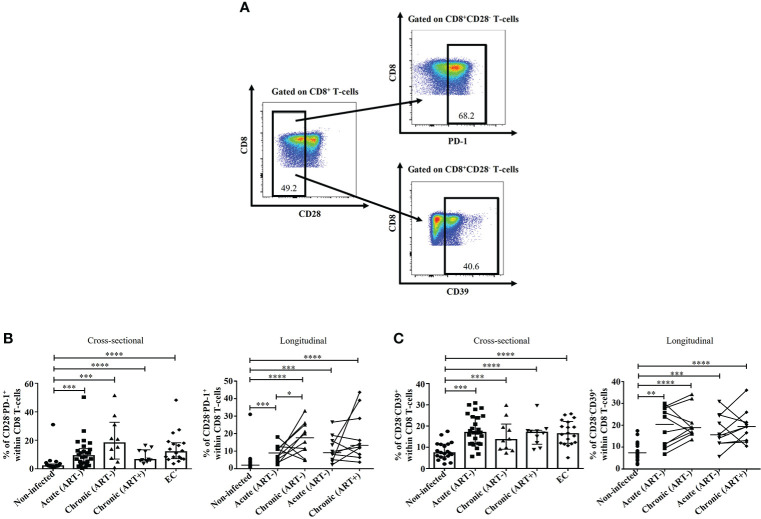
Results: Acute and chronic infection were associated with increased total, effector memory, and terminally differentiated FoxP3+ CD8 T-cells, while early ART normalized only the frequencies of total FoxP3+ CD8 T-cells. We observed an increase in FoxP3+ CD8 T-cell immune activation (HLADR+/CD38+), senescence (CD57+/CD28-), and PD-1 expression during acute and chronic infection, which were not normalized by early ART. FoxP3+ CD8 T-cells in untreated participants expressed higher levels of immunosuppressive LAP(TGF-β1) and CD39 than uninfected controls, whereas early ART did not affect their expression. The expression of gut-homing markers CCR9 and Integrin-β7 by total FoxP3+ CD8 T-cells and CD39+ and LAP(TGF-β1)+ FoxP3+ CD8 T-cells increased in untreated individuals and remained higher than in uninfected controls despite early ART. Elite controllers share most of the FoxP3+ CD8 T-cell characteristics in uninfected individuals.
Conclusions: Although early ART normalized total FoxP3+ CD8 T-cells frequencies, it did not affect the persistent elevation of the gut-homing potential of CD39+ and LAP(TGF-β1)+ FoxP3+ CD8 T-cell, which may contribute to immune dysfunction.
Keywords: CD39; CD8 regulatory T cells (CD8 Tregs); FoxP3; TGF-β1; acute HIV infection; early antiretroviral therapy (ART).
Copyright © 2022 Yero, Shi, Routy, Tremblay, Durand, Costiniuk and Jenabian.
Conflict of interest statement
The authors declare that the research was conducted in the absence of any commercial or financial relationships that could be construed as a potential conflict of interest.
Figures
Similar articles
-
Dynamics and epigenetic signature of regulatory T-cells following antiretroviral therapy initiation in acute HIV infection.EBioMedicine. 2021 Sep;71:103570. doi: 10.1016/j.ebiom.2021.103570. Epub 2021 Sep 6. EBioMedicine. 2021. PMID: 34500304 Free PMC article.
-
Double-Negative T-Cells during Acute Human Immunodeficiency Virus and Simian Immunodeficiency Virus Infections and Following Early Antiretroviral Therapy Initiation.Viruses. 2024 Oct 14;16(10):1609. doi: 10.3390/v16101609. Viruses. 2024. PMID: 39459942 Free PMC article.
-
Differential Dynamics of Regulatory T-Cell and Th17 Cell Balance in Mesenteric Lymph Nodes and Blood following Early Antiretroviral Initiation during Acute Simian Immunodeficiency Virus Infection.J Virol. 2019 Sep 12;93(19):e00371-19. doi: 10.1128/JVI.00371-19. Print 2019 Oct 1. J Virol. 2019. PMID: 31315987 Free PMC article.
-
Harnessing CD8+ T Cells Under HIV Antiretroviral Therapy.Front Immunol. 2019 Feb 26;10:291. doi: 10.3389/fimmu.2019.00291. eCollection 2019. Front Immunol. 2019. PMID: 30863403 Free PMC article. Review.
-
Elevation and persistence of CD8 T-cells in HIV infection: the Achilles heel in the ART era.J Int AIDS Soc. 2016 Mar 3;19(1):20697. doi: 10.7448/IAS.19.1.20697. eCollection 2016. J Int AIDS Soc. 2016. PMID: 26945343 Free PMC article. Review.
Cited by
-
Effects of Oral Cannabinoids on Systemic Inflammation and Viral Reservoir Markers in People with HIV on Antiretroviral Therapy: Results of the CTN PT028 Pilot Clinical Trial.Cells. 2023 Jul 8;12(14):1811. doi: 10.3390/cells12141811. Cells. 2023. PMID: 37508476 Free PMC article.
-
Mucosal immunity in acute HIV: a review of recent work.Curr Opin HIV AIDS. 2025 May 1;20(3):193-198. doi: 10.1097/COH.0000000000000917. Epub 2025 Jan 24. Curr Opin HIV AIDS. 2025. PMID: 39903645 Review.
-
Immune Checkpoint Molecules and Glucose Metabolism in HIV-Induced T Cell Exhaustion.Biomedicines. 2022 Nov 4;10(11):0. doi: 10.3390/biomedicines10112809. Biomedicines. 2022. PMID: 36359329 Free PMC article. Review.
-
Case report: Bullous pemphigoid in HIV-1-positive patients: interplay or coincidence? A case series and review of the literature.Front Immunol. 2023 May 24;14:1179294. doi: 10.3389/fimmu.2023.1179294. eCollection 2023. Front Immunol. 2023. PMID: 37292193 Free PMC article. Review.
References
-
- Vieyra-Lobato MR, Vela-Ojeda J, Montiel-Cervantes L, Lopez-Santiago R, Moreno-Lafont MC. Description of CD8(+) regulatory T lymphocytes and their specific intervention in graft-versus-Host and infectious diseases, autoimmunity, and cancer. J Immunol Res (2018) 2018:3758713. doi: 10.1155/2018/3758713 - DOI - PMC - PubMed
Publication types
MeSH terms
Substances
LinkOut - more resources
Full Text Sources
Medical
Research Materials