. 2022 Jul 27:13:920227.
doi: 10.3389/fimmu.2022.920227. eCollection 2022.

Coordinated innate and T-cell immune responses in mild COVID-19 patients from household contacts of COVID-19 cases during the first pandemic wave

Affiliations

Coordinated innate and T-cell immune responses in mild COVID-19 patients from household contacts of COVID-19 cases during the first pandemic wave

Alessandra Aiello et al. Front Immunol. .

Abstract

Objective: To better define the immunopathogenesis of COVID-19, the present study aims to characterize the early immune responses to SARS-CoV-2 infection in household contacts of COVID-19 cases. In particular, innate, T- and B-cell specific responses were evaluated over time.

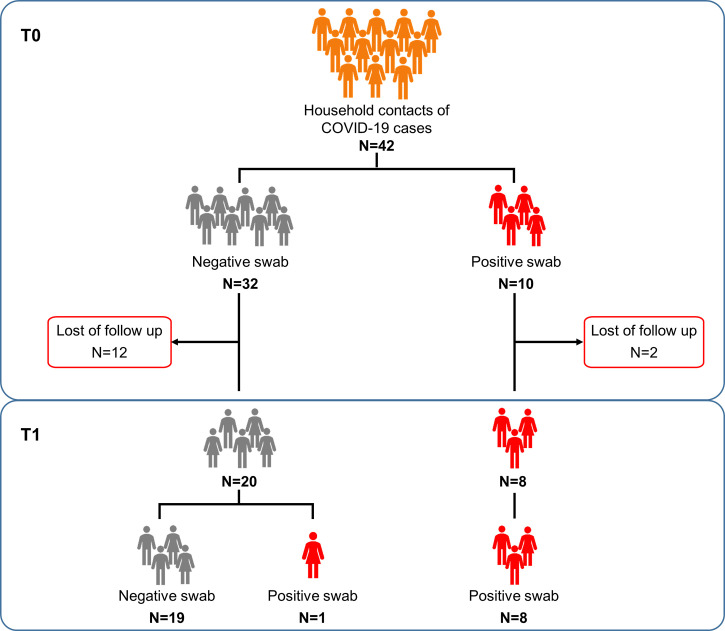
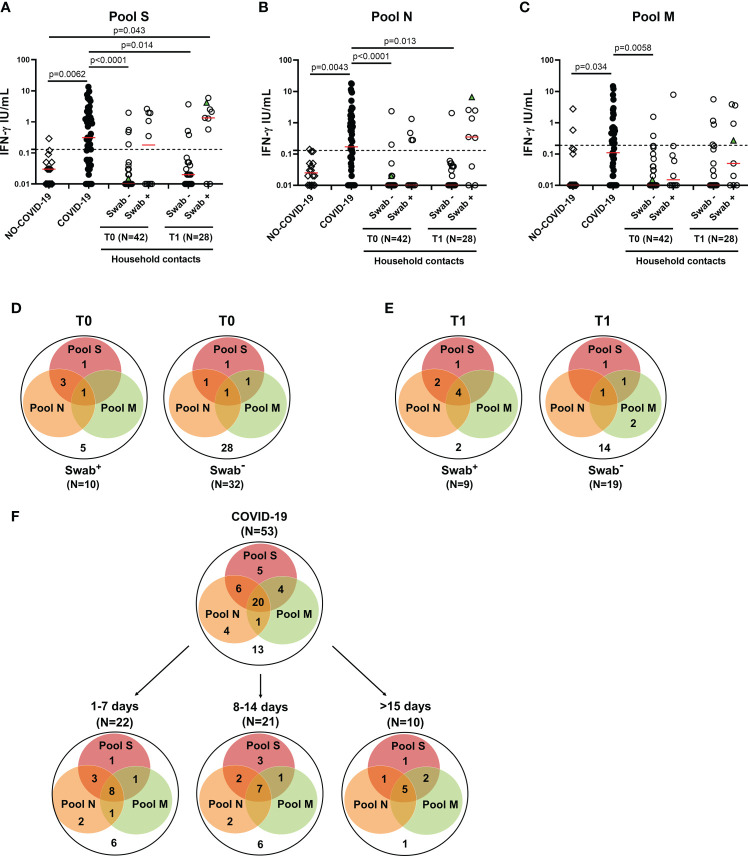
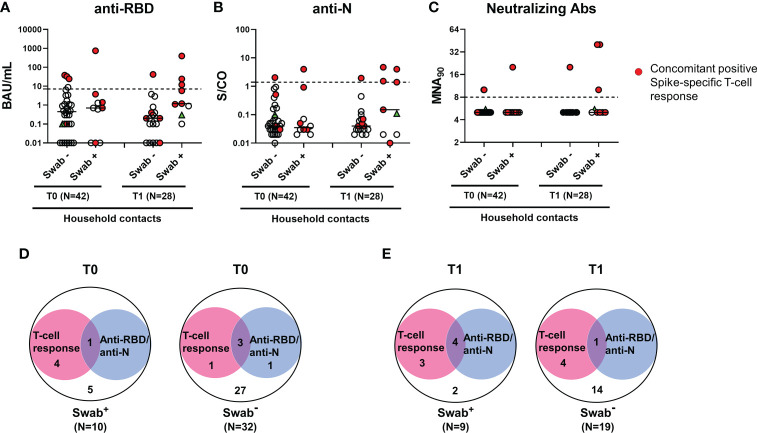
Methods: Household contacts of COVID-19 cases screened for SARS-CoV-2 infection by nasopharyngeal swab for surveillance purposes were enrolled (T0, n=42). Of these, 28 subjects returned for a follow-up test (T1). The innate response was assessed by detecting a panel of soluble factors by multiplex-technology in plasma samples. Cell-mediated response was evaluated by measuring interferon (IFN)-γ levels by ELISA in plasma harvested from whole-blood stimulated with SARS-CoV-2 peptide pools, including spike (S), nucleocapsid (N) and membrane (M) proteins. The serological response was assessed by quantifying anti-Receptor-Binding-Domain (RBD), anti-Nucleocapsid (N), whole virus indirect immunofluorescence, and neutralizing antibodies.

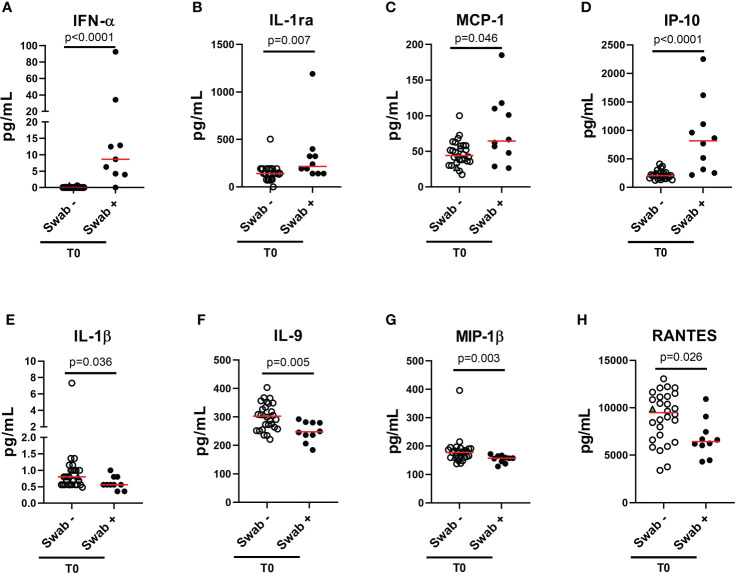
Results: At T0, higher levels of plasmatic IFN-α, IL-1ra, MCP-1 and IP-10, and lower levels of IL-1β, IL-9, MIP-1β and RANTES were observed in subjects with positive swab compared to individuals with a negative one (p<0.05). Plasmatic IFN-α was the only cytokine detectable in subjects with positive SARS-CoV-2 swabs with high accuracy for swab score positivity (0.93, p<0.0001). Among subjects with positive swabs, significant negative correlations were found among the RT-PCR cycle threshold values reported for genes S and N and IFN-α or IP-10 levels. At T0, the IFN-γ T-cell specific response was detected in 50% (5/10) of subjects with positive swab, while anti-RBD/anti-N antibodies showed a positivity rate of 10% (1/10). At T1, the IFN-γ T-cell specific response was detected in most of the confirmed-infection subjects (77.8%, 7/9), whereas the serological response was still observed in a minority of them (44.4%, 4/9). Overall, the swab test showed a moderate concordance with the T-cell response (78.6%, k=0.467), and a scarce concordance with the serological one (72.9%, k=0.194).

Conclusions: Plasmatic IFN-α and the IFN-γ T-cell specific response appear early even in the absence of seroconversion, and show a greater positivity rate than the serological response in household contacts with positive swab.

Keywords: COVID-19; Interferon-alpha (IFN-α); Interferon-gamma (IFN-γ) release assay (IGRA); SARS-CoV-2; T-cell response; household contacts; spike protein; whole blood.


Conflict of interest statement

EG has received grants form Gilead and Mylan. EN is a member of the advisory board by Gilead, Lilly and Roche and received fees for educational training by Gilead, Lilly and Roche. DG is a member of the advisory board by Biomerieux and Eli-Lilly, and received fees for educational training or consultancy by Biogen, Cellgene, Diasorin, Janssen, Qiagen, Quidel. The remaining authors declare that the research was conducted in the absence of any commercial or financial relationships that could be construed as a potential conflict of interest.

Figures

Figure 1
Figure 1
Flow chart of the enrolled household contacts of COVID-19 cases. Household contacts of COVID-19 cases (n=42) were enrolled and analyzed at the execution of the first nasopharyngeal swab (T0) and after 7-20 days (T1), at the end of the quarantine period. Twenty-eight of these subjects returned to follow-up. Footnote: COVID-19, COronaVIrus Disease 2019.
Figure 2
Figure 2
Plasmatic cytokines/chemokines modulated in household contacts at baseline. (A–H) Household contacts at T0 (n = 38) were stratified according to the swab result: positive (n = 10) and negative (n = 28). Plasma harvested from unstimulated blood samples were tested for the detection of 27 cytokines/chemokines using the Bio-Plex Pro Human Cytokine 27-plex Assay and for the detection of IFN-α and-β by means of an automatic ELISA. Red horizontal lines indicate medians. The green triangle identifies the subject with a positive swab only at T1. Statistical analysis was performed using Mann-Whitney U test to compare swab positive and negative subjects. A p < 0.05 was considered significant. IL, interleukin; MCP, monocyte chemoattractant protein; MIP, macrophage inflammatory protein; IP, Interferon-gamma induced protein; RANTES, regulated on activation IFN, interferon.
Figure 3
Figure 3
T-cell response in household contacts of COVID-19 subjects. (A-C) Evaluation of IFN-γ levels in response to SARS-CoV-2 peptides in household contacts at T0 (n = 42) and T1 (n = 28) after whole-blood stimulation with 0.1 µg/mL of pools S (A) and M (C), and 1 µg/mL of pool N (B). Healthy donors (n=16) and COVID-19 patients (n = 53) were used as negative and positive control groups, respectively. The household contacts were stratified according to the swab result. The IFN-γ levels were assessed in plasma from stimulated whole-blood samples and reported by subtracting the background. The cut-off for each peptide pool was represented by a dashed line (pools S and N: 0.13 IU/mL; pool M: 0.19 IU/mL). Green triangle indicates the subject who scored positive only at T1. The red horizontal lines indicate the median. (D, E) Venn diagrams show the number of household contacts of COVID-19 cases at T0 and T1 with a positive response to the different SARS-CoV-2 peptides pools. (F) Venn diagrams show the number of confirmed hospitalized COVID-19 patients with a positive response to the different SARS-CoV-2 peptides pools, stratifying the results also with respect to days from symptom onset. The statistical comparison was done with the Kruskal-Wallis test and the Dunn’s multiple comparisons test, and p<0.05 was considered significant. IFN, interferon; COVID-19, COronaVIrus Disease 2019; S, spike; N, nucleocapsid; M, membrane.
Figure 4
Figure 4
Antibody response in household contacts of COVID-19 cases. Evaluation of SARS-CoV-2-specific anti-RBD (A), anti-N (B) and neutralizing (C) antibodies in household contacts at T0 (n=42) and T1 (n=28). Anti-RBD, anti-N and neutralizing antibodies were evaluated in sera samples and reported as Binding Antibody Units (BAU)/mL (A), Sample/Cutoff (S/CO) (B), and reciprocal of dilution (MNA90) (C), respectively. Red dots indicate subjects with also a concomitant IFN-γ specific response as shown in the figure legend. Green triangle indicates the subject with positive swab only at T1. Dashed lines indicate the cut-off (anti-RBD: 7.1 BAU/mL; anti-N: 1.4 (S/CO); MNA90: 8). The black horizontal lines indicate the median. (D, E) Venn diagrams show the number of household contacts of COVID-19 cases at T0 and T1 with an IFN-γ response and/or the serological one (anti-RBD and anti-N). Statistical analysis was performed using Fisher’s exact test with Bonferroni correction and p<0.01 was considered significant. IFN, interferon; COVID-19, COronaVIrus Disease 2019; RBD, receptor binding domain; N, nucleocapsid.

References

    1. Wu F, Liu M, Wang A, Lu L, Wang Q, Gu C, et al. Evaluating the association of clinical characteristics with neutralizing antibody levels in patients who have recovered from mild COVID-19 in shanghai, China. JAMA Intern Med (2020) 180:1356–62. doi: 10.1001/jamainternmed.2020.4616 - DOI - PMC - PubMed
    1. Guan W-J, Ni Z-Y, Hu Y, Liang W-H, Ou C-Q, He J-X, et al. Clinical characteristics of coronavirus disease 2019 in China. N Engl J Med (2020) 382:1708–20. doi: 10.1056/NEJMoa2002032 - DOI - PMC - PubMed
    1. Wölfel R, Corman VM, Guggemos W, Seilmaier M, Zange S, Müller MA, et al. Virological assessment of hospitalized patients with COVID-2019. Nature (2020) 581:465–9. doi: 10.1038/s41586-020-2196-x - DOI - PubMed
    1. Wu Z, McGoogan JM. Characteristics of and important lessons from the coronavirus disease 2019 (COVID-19) outbreak in China: Summary of a report of 72 314 cases from the Chinese center for disease control and prevention. JAMA (2020) 323:1239–42. doi: 10.1001/jama.2020.2648 - DOI - PubMed
    1. Merad M, Martin JC. Pathological inflammation in patients with COVID-19: a key role for monocytes and macrophages. Nat Rev Immunol (2020) 20:355–62. doi: 10.1038/s41577-020-0331-4 - DOI - PMC - PubMed

Publication types