. 2022 Jul 28:13:931194.
doi: 10.3389/fimmu.2022.931194. eCollection 2022.

MDA5 signaling induces type 1 IFN- and IL-1-dependent lung vascular permeability which protects mice from opportunistic fungal infection

Affiliations

MDA5 signaling induces type 1 IFN- and IL-1-dependent lung vascular permeability which protects mice from opportunistic fungal infection

Michael J Davis et al. Front Immunol. .

Abstract

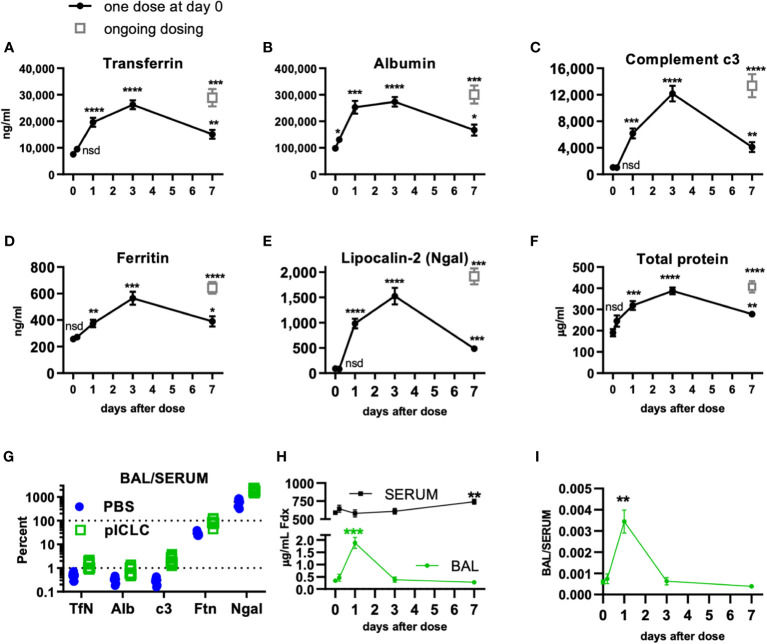
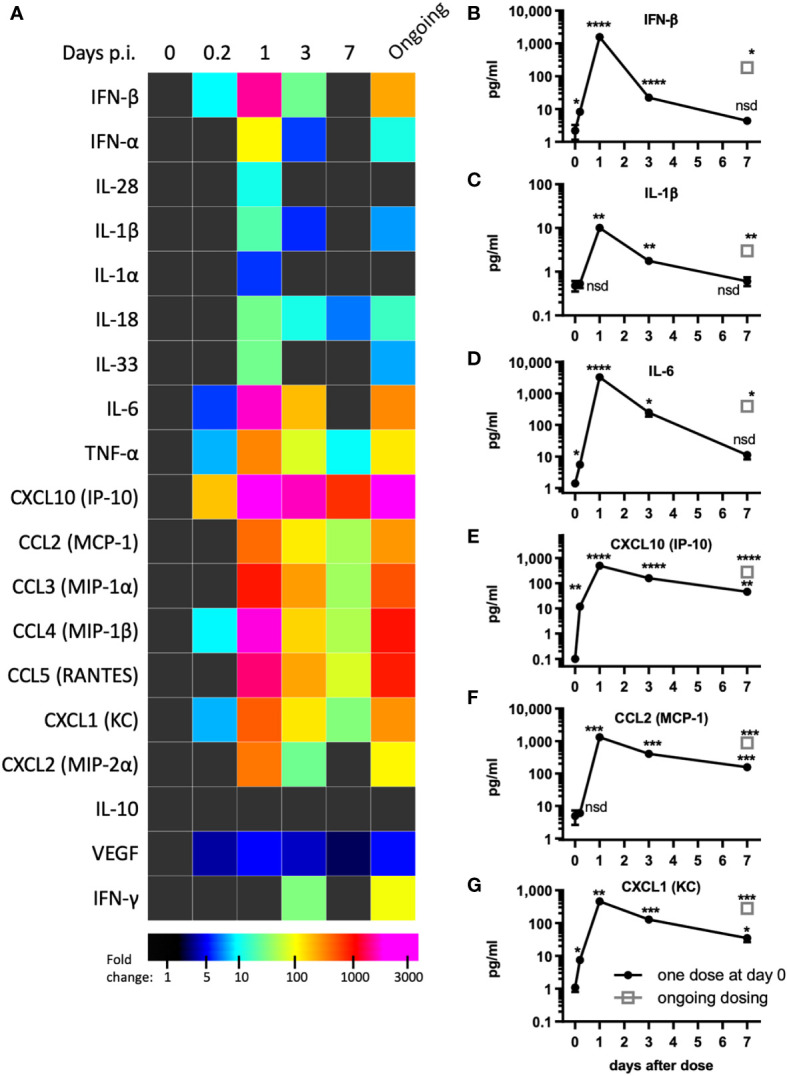
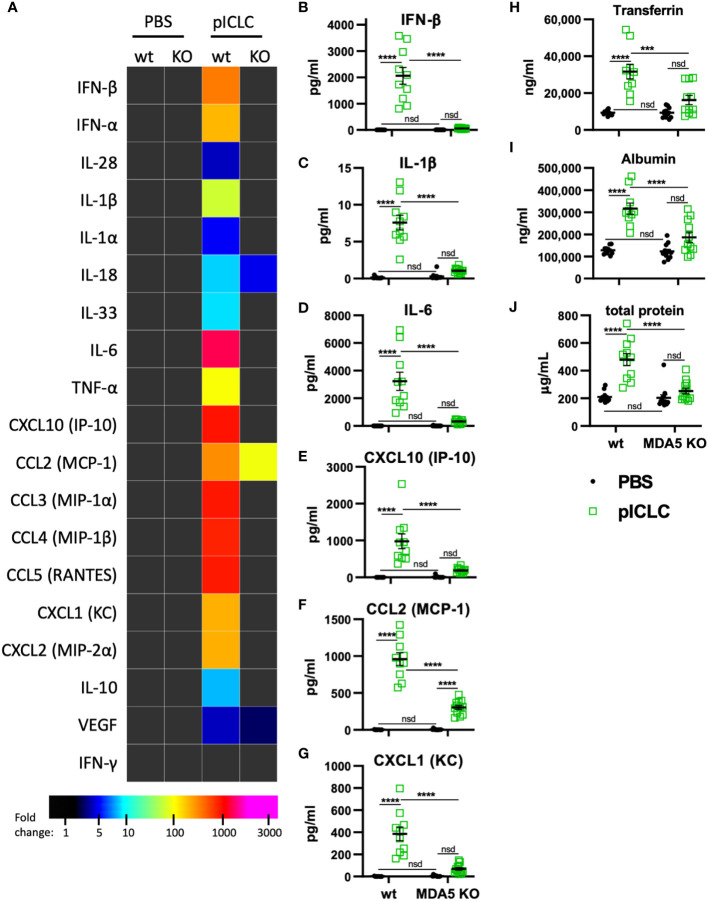
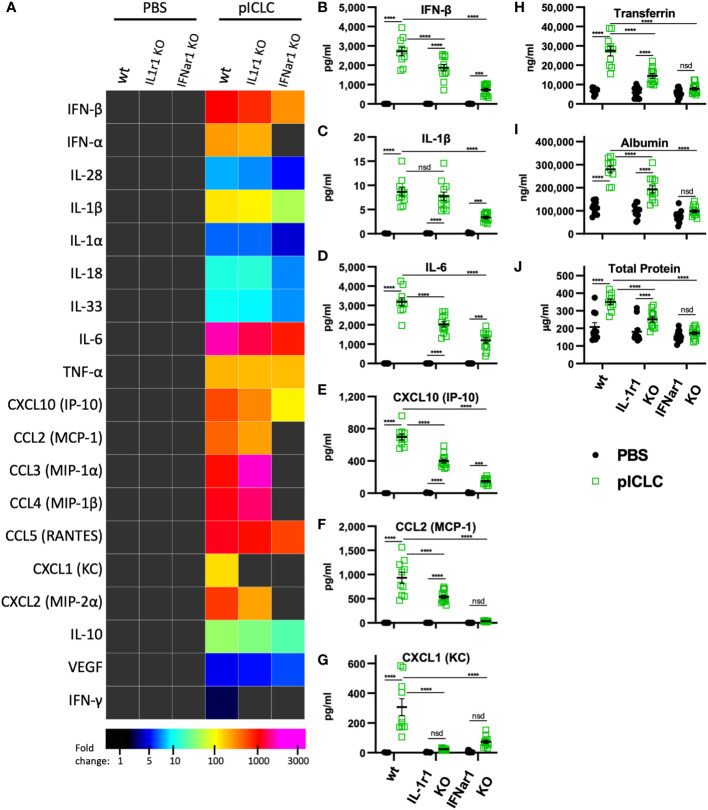
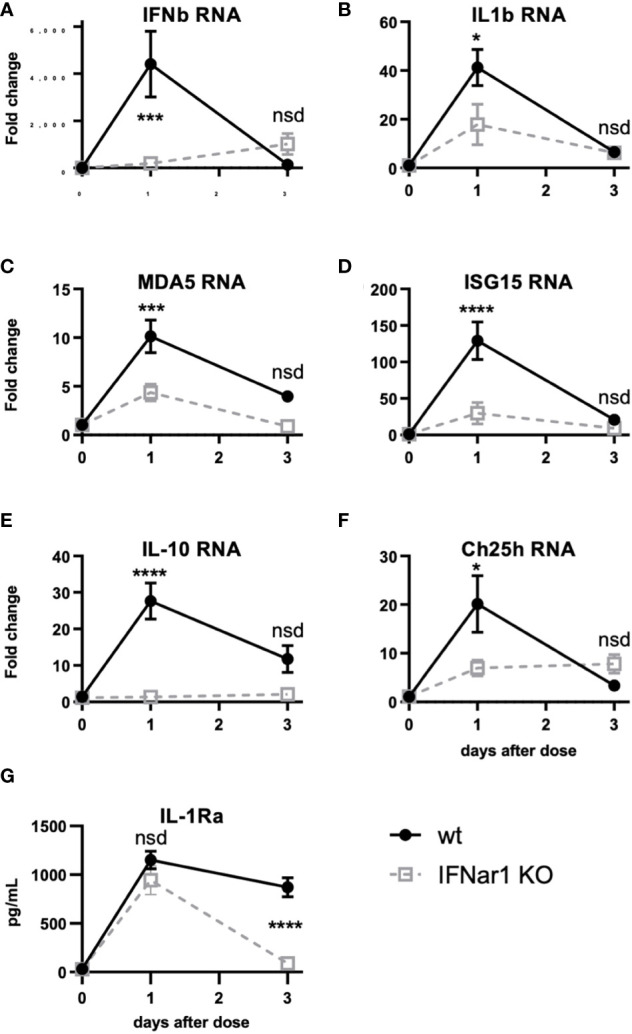
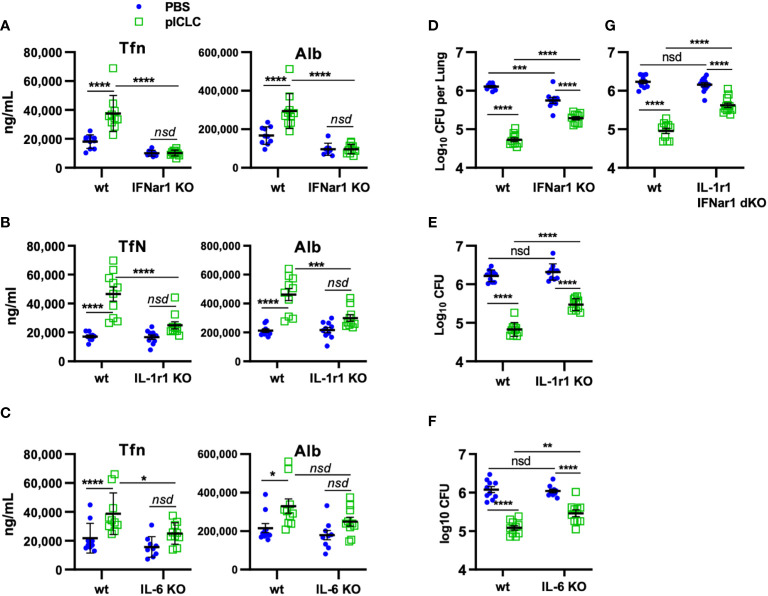
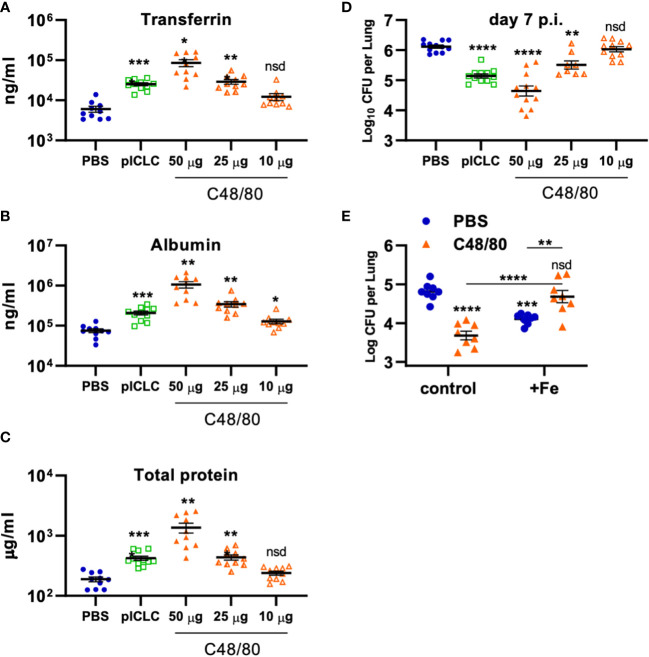
Lungs balance threat from primary viral infection, secondary infection, and inflammatory damage. Severe pulmonary inflammation induces vascular permeability, edema, and organ dysfunction. We previously demonstrated that poly(I:C) (pICLC) induced type 1 interferon (t1IFN) protected mice from Cryptococcus gattii (Cg) via local iron restriction. Here we show pICLC increased serum protein and intravenously injected FITC-dextran in the lung airspace suggesting pICLC induces vascular permeability. Interestingly, pICLC induced a pro-inflammatory signature with significant expression of IL-1 and IL-6 which depended on MDA5 and t1IFN. Vascular permeability depended on MDA5, t1IFN, IL-1, and IL-6. T1IFN also induced MDA5 and other MDA5 signaling components suggesting that positive feedback contributes to t1IFN dependent expression of the pro-inflammatory signature. Vascular permeability, induced by pICLC or another compound, inhibited Cg by limiting iron. These data suggest that pICLC induces t1IFN which potentiates pICLC-MDA5 signaling increasing IL-1 and IL-6 resulting in leakage of antimicrobial serum factors into lung airspace. Thus, induced vascular permeability may act as an innate defense mechanism against opportunistic fungal infection, such as cryptococcosis, and may be exploited as a host-directed therapeutic target.

Keywords: Cryptococcus; IL-1; edema; inflammation; interferon; lungs.


Conflict of interest statement

The authors declare that the research was conducted in the absence of any commercial or financial relationships that could be construed as a potential conflict of interest.

Figures

Figure 1
Figure 1
Locally dosing mice with pICLC results in accumulation of serum proteins in the lung airspace. C57BL6 mice were dosed with 5 µg of pICLC by intrapharyngeal aspiration either once at day 0 (black closed circles with lines) or repeatedly (grey open boxes; ongoing dosing) on days 0, 3, and 6. (A–F) BAL samples were acquired at indicated time points. See Supplemental Figures 1A, B for dosing and sampling schematic. Analytes from BAL samples were measured using ELISA (A–E) or total protein assay (F). N = 10-14 mice per timepoint per group combined from 3 independent experiments. Statistics analyzed by one way Brown-Forsythe ANOVA and subsequent multiple comparison corrected t-tests compared to PBS control. (G) Paired serum and BAL samples were acquired 3 days following pICLC or PBS dosing and analyzed by ELISA. BAL analyte concentrations were divided by serum concentrations from the same animals. N = 9-10 mice per group combined from 2 independent experiments. (H, I) Mice were dosed once with pICLC or PBS as in A-F then intravenously injected with 4 µg FITC-dextran (Fdx). Fdx levels in paired BAL and serum samples were measured 3 hours after Fdx injection. N = 8-10 mice per timepoint per group combined from 2 independent experiments. **** indicates p < 0.0001, *** indicates p < 0.0002, ** indicates p < 0.0021, * indicates p < 0.0332, nsd indicates not statistically different.
Figure 2
Figure 2
pICLC induces type 1 IFN and inflammatory cytokines and chemokines. Mice were dosed with pICLC or control as in Figures 1A–F and cytokine and chemokine levels were measured in BAL samples by bead-based assay. (A) Fold change values are displayed using a heatmap. (B–G) data from select analytes are graphed as in (A-F). N = 10 mice per timepoint per group combined from 2 independent experiments. Statistics analyzed by one way Brown-Forsythe ANOVA and subsequent multiple comparison corrected t-tests compared to PBS control. **** indicates p < 0.0001, *** indicates p < 0.0002, ** indicates p < 0.0021, * indicates p < 0.0332, nsd indicates not statistically different.
Figure 3
Figure 3
pICLC-induced cytokine and permeability responses are MDA5 dependent. MDA5 KO (KO) and C57BL6 control mice (wt) were dosed with PBS (black symbols) or pICLC (green) and BAL samples acquired 1 day (A–G) or 3 days (H-J) later. See Supplemental Figure 1C for dosing and sampling schematic. (A–G) Cytokine and chemokine levels measured in BAL samples by bead-based assay as in Figure 2 and displayed by heatmap (A) or graphs of selected analytes (B–G). Markers of vascular permeability were measured by ELISA (H, I) or BCA assay (J) as in Figure 1. For (A–J), N = 10-12 mice per group combined from 2 independent experiments. Statistics analyzed by two-way ANOVA and subsequent Tukey multiple comparison tests. **** indicates p < 0.0001, *** indicates p < 0.0002, nsd indicates not statistically different.
Figure 4
Figure 4
pICLC-induced vascular permeability depends on both t1IFN and IL-1, while the pICLC-induced cytokine response depends mostly on t1IFN. IFNar1 KO, IL-1r1 KO, and C57BL6 control mice (wt) were dosed with PBS (black symbols) or pICLC (green) and BAL samples acquired 1 day (A–G) or 3 days (H–J) later. See Supplemental Figure 1C for dosing and sampling schematic. Cytokine and vascular permeability analytes measured and displayed as in previous experiments. For (A–J), N = 10-12 mice per group combined from 2 independent experiments. Statistics analyzed by two-way ANOVA and subsequent Tukey multiple comparison tests. **** indicates p < 0.0001, *** indicates p < 0.0002, nsd indicates not statistically different.
Figure 5
Figure 5
t1IFN induces expression of MDA5 and ISG15 as well as downstream genes, including IL-1. IFNar1 KO and C57BL6 control mice (wt) were dosed with PBS (time point 0) or pICLC and lung mRNA (A-F) or lung homogenate (G) harvested 1 or 3 days later. (A-F) mRNA levels for indicated genes were measured by qPCR. (G) IL-1Ra levels were measured by ELISA. N = 8 mice per group combined from 2 independent experiments. Statistics analyzed by two way ANOVA and subsequent Tukey multiple comparison tests. **** indicates p < 0.0001, *** indicates p < 0.0002, * indicates p < 0.0332, nsd indicates not statistically different.
Figure 6
Figure 6
pICLC-mediated protection from opportunistic C. gattii infection depends on t1IFN, IL-1, and IL-6. IFNar1 KO, IL-1r1 KO, IL-6 KO, IFNar1 and IL-1r1 double KO, and C57BL6 control mice (wt) were infected with Cryptococcus gattii (5000 cells) and dosed with PBS (blue symbols) or pICLC (green). 7 days post infection BAL samples were analyzed by ELISA for markers of vascular permeability (A–C) and lung homogenates were analyzed for fungal load (D–G). See Supplemental Figure 1D for dosing and sampling schematic. N = 8-10 mice per group combined from 2 independent experiments. Statistics analyzed by two-way ANOVA and subsequent Tukey multiple comparison tests. **** indicates p < 0.0001, *** indicates p < 0.0002, ** indicates p < 0.0021, * indicates p < 0.0332, nsd indicates not statistically different.
Figure 7
Figure 7
Vascular permeability induced by pICLC or compound 48/80 inhibits C. gattii in mice. (A-C) C57BL6 mice were dosed with PBS, 5 µg of pICLC, or indicated doses of compound 48/80. BAL samples were acquired after 3 days and vascular permeability marker levels measured by ELISA (A, B) or BCA (C). See Supplemental Figure 1C for dosing and sampling schematic. N = 10-11 mice per group combined from 2 independent experiments. (D) C57BL6 mice were infected with Cg and dosed with PBS, 5 µg of pICLC, or indicated doses of compound 48/80. Lung fungal burdens were measured from lung homogenates after 7 days; see Supplemental Figure 1D. N = 8-12 mice per group combined from 3 independent experiments. For (A-D), Statistics analyzed by one way Brown-Forsythe ANOVA and subsequent multiple comparison corrected t-tests compared to PBS control. (E) C57BL6 mice were dosed with PBS (Blue) or 50 µg compound 48/80 (orange) with or without additional 6.25 µg iron chloride the day before infection with Cg (6.25 µg iron chloride was included again in indicated groups). Compound 48/80 and iron chloride dosing was repeated on day 2 and lung fungal burdens were measured from lung homogenates 3 days after Cg infection. See Supplemental Figure 1E for dosing and sampling schematic. Statistics analyzed by two-way ANOVA and subsequent Tukey multiple comparison tests. **** indicates p < 0.0001, *** indicates p < 0.0002, ** indicates p < 0.0021, * indicates p < 0.0332, nsd indicates not statistically different.

Similar articles

References

    1. Centers for Disease C.Prevention . Emergence of Cryptococcus gattii– pacific Northwest, 2004-2010. MMWR Morb Mortal Wkly Rep (2010) 59:865–8. - PubMed
    1. Datta K, Bartlett KH, Baer R, Byrnes E, Galanis E, Heitman J, et al. . Spread of Cryptococcus gattii into pacific Northwest region of the united states. Emerg Infect Dis (2009) 15:1185–91. doi: 10.3201/eid1508.081384 - DOI - PMC - PubMed
    1. Stephen C, Lester S, Black W, Fyfe M, Raverty S. Multispecies outbreak of cryptococcosis on southern Vancouver island, British Columbia. Can Vet J (2002) 43:792–4. - PMC - PubMed
    1. Chen SC, Meyer W, Sorrell TC. Cryptococcus gattii infections. Clin Microbiol Rev (2014) 27:980–1024. doi: 10.1128/CMR.00126-13 - DOI - PMC - PubMed
    1. Seaton RA, Naraqi S, Wembri JP, Warrell DA. Predictors of outcome in Cryptococcus neoformans var. gattii meningitis. QJM (1996) 89:423–8. doi: 10.1093/qjmed/89.6.423 - DOI - PubMed

LinkOut - more resources