. 2022 Jul 28:13:960918.
doi: 10.3389/fimmu.2022.960918. eCollection 2022.

Transcriptional dynamics and epigenetic regulation of E and ID protein encoding genes during human T cell development

Affiliations

Transcriptional dynamics and epigenetic regulation of E and ID protein encoding genes during human T cell development

Juliette Roels et al. Front Immunol. .

Abstract

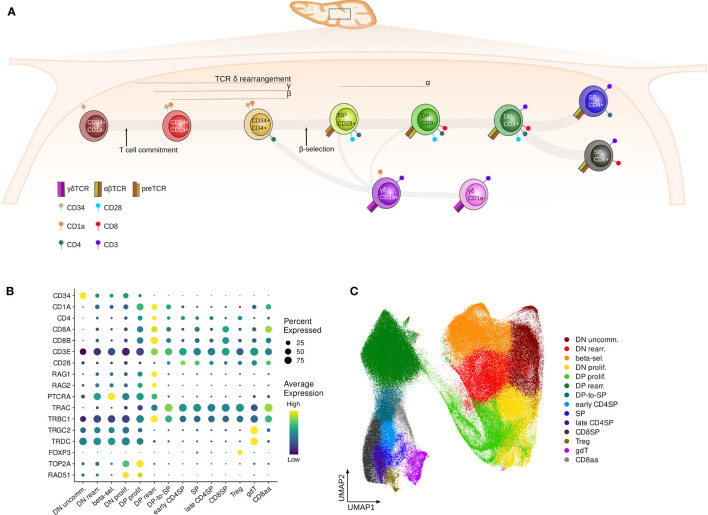
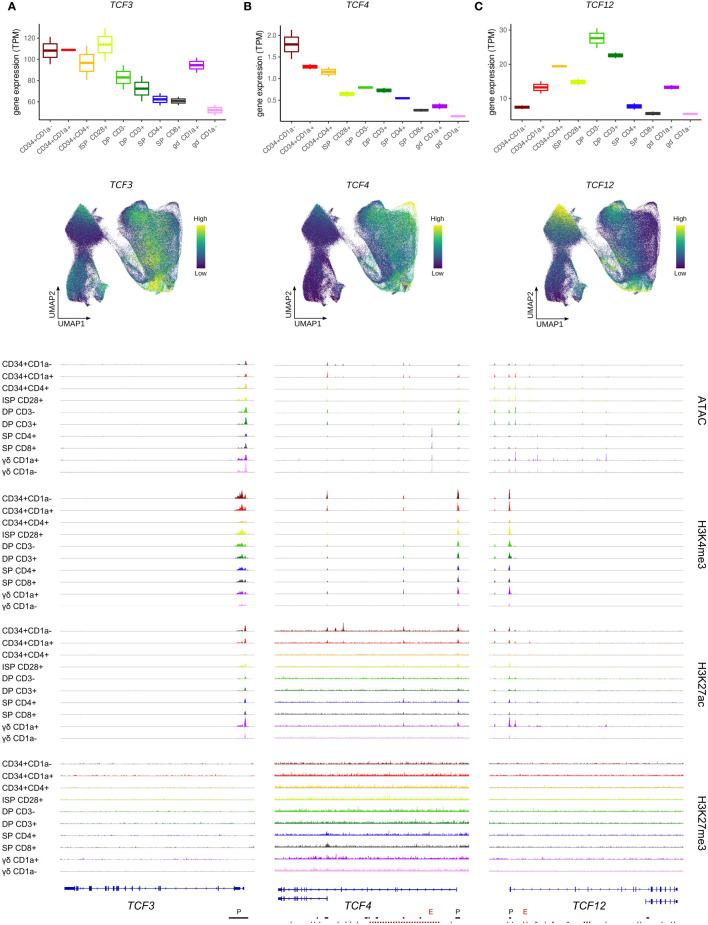
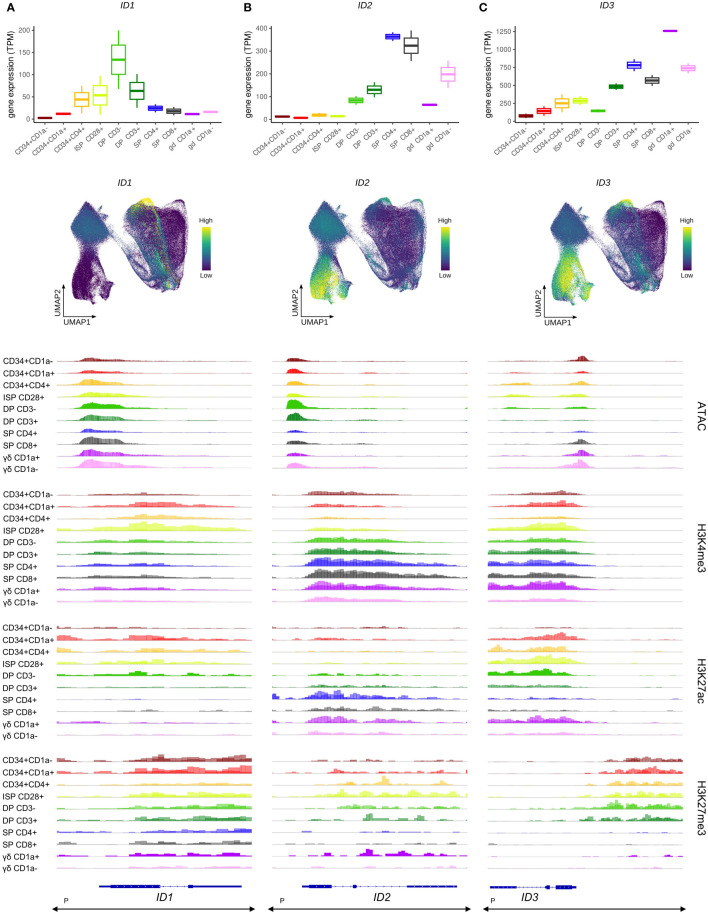
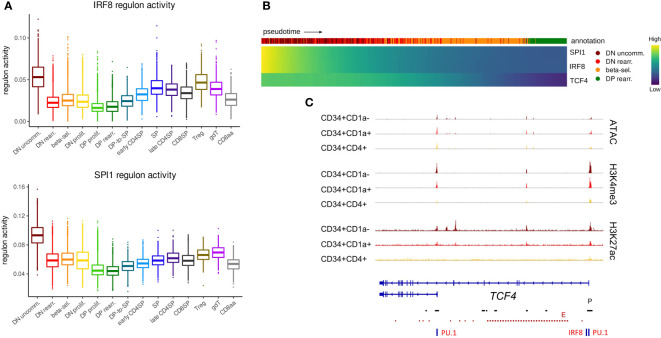
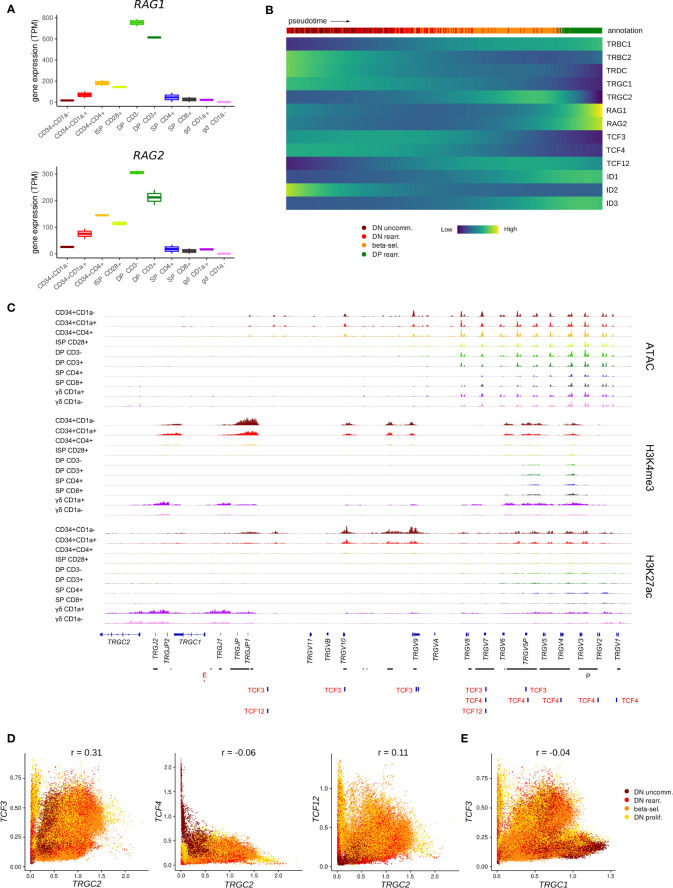
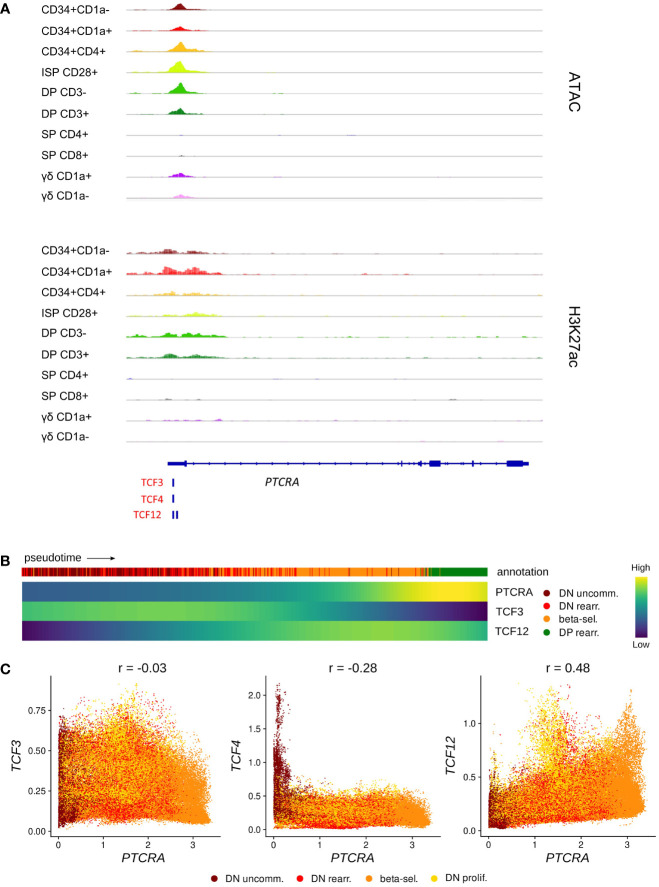
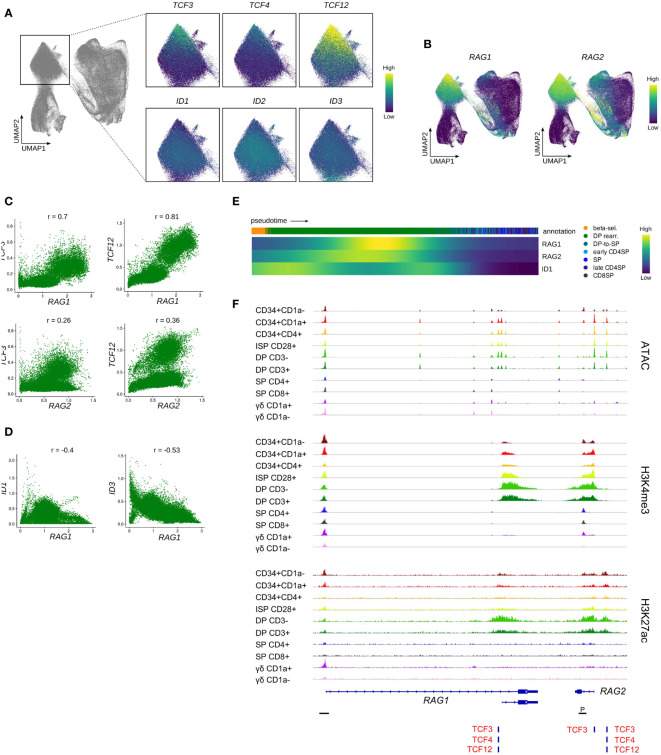
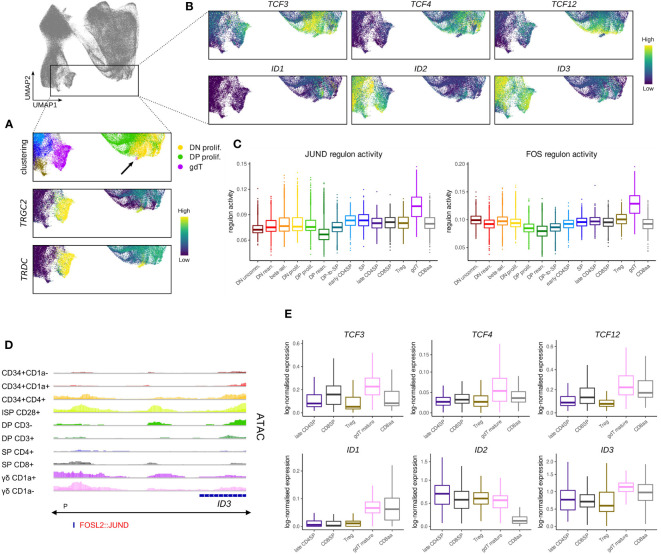
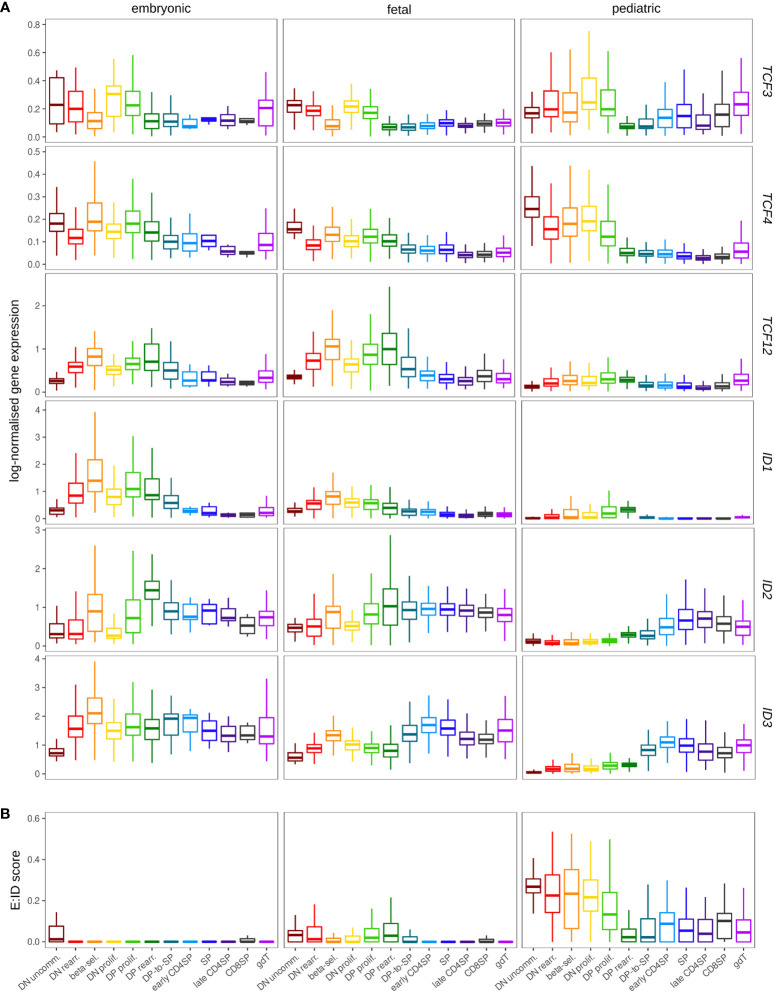
T cells are generated from hematopoietic stem cells through a highly organized developmental process, in which stage-specific molecular events drive maturation towards αβ and γδ T cells. Although many of the mechanisms that control αβ- and γδ-lineage differentiation are shared between human and mouse, important differences have also been observed. Here, we studied the regulatory dynamics of the E and ID protein encoding genes during pediatric human T cell development by evaluating changes in chromatin accessibility, histone modifications and bulk and single cell gene expression. We profiled patterns of ID/E protein activity and identified up- and downstream regulators and targets, respectively. In addition, we compared transcription of E and ID protein encoding genes in human versus mouse to predict both shared and unique activities in these species, and in prenatal versus pediatric human T cell differentiation to identify regulatory changes during development. This analysis showed a putative involvement of TCF3/E2A in the development of γδ T cells. In contrast, in αβ T cell precursors a pivotal pre-TCR-driven population with high ID gene expression and low predicted E protein activity was identified. Finally, in prenatal but not postnatal thymocytes, high HEB/TCF12 levels were found to counteract high ID levels to sustain thymic development. In summary, we uncovered novel insights in the regulation of E and ID proteins on a cross-species and cross-developmental level.

Keywords: E proteins; ID proteins; T cell development; epigenetics; gene regulation; gene regulatory networks; human; thymocytes.


Conflict of interest statement

The authors declare that the research was conducted in the absence of any commercial or financial relationships that could be construed as a potential conflict of interest.

Figures

Figure 1
Figure 1
Surface markers distinguish subsequent stages of human thymocyte development. (A) Schematic depiction of stages of T cell development in the human thymus. (B) Dot plot visualizing pseudo-bulk expression of known thymocyte markers per annotated cluster in the pediatric single cell data set. Non-imputed data was log-normalized, averaged and scaled by gene. (C) UMAP visualizing the annotated clusters in the pediatric single cell thymus data set.
Figure 2
Figure 2
Expression of E protein encoding genes throughout human thymocyte development. (A) Transcript levels of TCF3 according to bulk RNA-seq (top) and single cell data (middle), and epigenetic profile at the TCF3 gene locus. (B) Transcript levels of TCF4 according to bulk RNA-seq (top) and single cell data (middle), and epigenetic profile at the TCF4 gene locus. Long and short isoform of TCF4 are shown. (C) Transcript levels of TCF12 according to bulk RNA-seq (top) and single cell data (middle), and epigenetic profile at the TCF12 gene locus. Long (HEBcan) and short isoform (HEBalt) of TCF12 are shown. Locations of promoters (P) and enhancers (E) were retrieved from the Ensembl Regulatory Build and are indicated below the gene structure. UMAP visualizations were generated using imputed data.
Figure 3
Figure 3
Transcription of ID protein encoding genes in developing human thymocytes. (A) Transcript levels of ID1 according to bulk RNA-seq (top) and single cell data (middle), and epigenetic profile at the ID1 gene locus. (B) Transcript levels of ID2 according to bulk RNA-seq (top) and single cell data (middle), and epigenetic profile at the ID2 gene locus. (C) Transcript levels of ID3 according to bulk RNA-seq (top) and single cell data (middle), and epigenetic profile at the ID3 gene locus. Locations of promoters (P) for all three genes was retrieved from the Ensembl Regulatory Build and was found to span the entire locus as indicated below the gene structure. UMAP visualizations were generated using imputed data.
Figure 4
Figure 4
TCF4, IRF8 and SPI1 are predicted to form a regulatory network in uncommitted DN thymocytes. (A) Activity of IRF8 and PU.1 regulons per cluster as predicted by running pySCENIC on the single cell data set. (B) Heatmap showing gene expression along differentiation pseudotime in immature thymocytes. Smoothed gene expression was determined based on a generalized additive model fitted on the cell pseudotimes, cells in pseudotime window of interest were selected and expression was scaled by gene prior to visualization. (C) Genome browser view of ATAC, H3K4me3, H3K27ac and PU.1/IRF8 motifs at the TCF4 locus. Locations of promoters (P) and enhancers (E) were retrieved from the Ensembl Regulatory Build and are indicated below the gene structure.
Figure 5
Figure 5
TCF3 expression is positively correlated with transcription of TRGC2. (A) Expression of RAG1 and RAG2 at different stages of thymocyte development according to bulk RNA-seq data. (B) Heatmap showing gene expression along differentiation pseudotime in immature thymocytes. Smoothed gene expression was determined based on a generalized additive model fitted on the cell pseudotimes, cells in pseudotime window of interest were selected and expression was scaled by gene prior to visualization. (C) Genome browser view of ATAC, H3K4me3, H3K27ac and E protein motifs at the TCRG locus. Locations of promoters (P) and enhancers (E) were retrieved from the Ensembl Regulatory Build and are indicated below the gene structure. (D) Scatter plot for imputed transcript levels of E protein encoding genes and TRGC2 in immature thymocytes. Cells are colored by cluster and Pearson correlation coefficient is shown. (E) Scatter plot for imputed transcript levels of TCF3 and TRGC1 in immature thymocytes. Cells are colored by cluster and Pearson correlation coefficient is shown.
Figure 6
Figure 6
TCF12 is predicted to act as positive regulator of PTCRA transcription. (A) Genome browser view of ATAC, H3K27ac and E protein motifs in the PTCRA promoter region. Locations of promoters (P) and enhancers (E) were queried in the Ensembl Regulatory Build but none were found for this locus. (B) Heatmap showing gene expression along differentiation pseudotime in immature thymocytes. Smoothed gene expression was determined based on a generalized additive model fitted on the cell pseudotimes, cells in pseudotime window of interest were selected and expression was scaled by gene prior to visualization. (C) Scatter plot for imputed transcript levels of E protein encoding genes and PTCRA in immature thymocytes. Cells are colored by cluster and Pearson correlation coefficient is shown.
Figure 7
Figure 7
ID protein encoding genes are strongly induced in a subset of β-selecting thymocytes. (A) UMAP visualization of ID protein encoding gene expression in the β-selecting thymocyte cluster. (B) UMAP visualization of the E:ID score calculated on a per-cell basis. (C) Dot plot visualizing pseudo-bulk expression of E and ID protein encoding genes and cluster 28 marker genes. Imputed, gene-scaled expression is shown for all subclusters comprising the beta-selecting cluster. (D) Scatter plot for imputed transcript levels of ID protein encoding genes and PTCRA in β-selecting thymocytes. Cells are colored by β-selecting subcluster and Pearson correlation coefficient is shown.
Figure 8
Figure 8
Transcription of E protein encoding genes is associated with RAG expression in rearranging DP thymocytes. (A) UMAP visualization of E and ID protein encoding gene expression in the rearranging DP thymocyte cluster. (B) UMAP visualization of RAG1 and RAG2 expression according to the single cell thymocyte data set. Transcripts were imputed prior to visualization. (C) Scatter plot for imputed transcript levels of TCF3, TCF12, RAG1 and RAG2 in rearranging DP thymocytes. Pearson correlation coefficient is shown. (D) Scatter plot for imputed transcript levels of ID1, ID3, and RAG1 in rearranging DP thymocytes. Pearson correlation coefficient is shown. (E) Heatmap showing gene expression along differentiation pseudotime in DP and SP thymocytes. Smoothed gene expression was determined based on a generalized additive model fitted on the cell pseudotimes, cells in pseudotime window of interest were selected and expression was scaled by gene prior to visualization. (F) Genome browser view of ATAC, H3K4me3, H3K27ac and E protein motifs at regulatory regions of the RAG gene locus. Locations of promoters (P) were retrieved from the Ensembl Regulatory Build and are indicated below the gene structure.
Figure 9
Figure 9
Transcription of TCF4 and TCF12 but not TCF3 is shut down in cells committing to the γδ lineage. (A) UMAP visualization of TRGC2 and TRDC expression in thymocytes of the γδ lineage. Annotated clusters are depicted in the top panel. (B) UMAP visualization of E and ID protein encoding genes in thymocytes of the γδ lineage. (C) Activity of JUND and FOS regulons per cluster as predicted by running pySCENIC on the single cell data set. (D) Genome browser view of chromatin accessibility and AP-1 family motif at a regulatory region downstream of ID3. Location of the ID3 promoter (P), as indicated below the gene structure, was found to span the entire locus. (E) Pseudo-bulk expression of E and ID protein encoding genes in mature thymocytes based on the single cell data set. For γδ lineage cells only a subcluster of mature γδTCR+ cells as indicated by low levels of CD1a was included.
Figure 10
Figure 10
Expression of ID protein encoding genes exhibits different patterns in the pre- and postnatal thymocytes. (A) Pseudo-bulk expression of E and ID protein encoding genes in thymocytes based on prenatal and pediatric single cell data sets. The prenatal data was divided into embryonic (≤10 wpc) and fetal (>10 wpc) samples. Note that only very few SP, early/late CD4+ and CD8+ SP thymocytes were detected in embryonic samples (see Figure S7C). (B) Average E:ID score per cell type in embryonic, fetal, and pediatric thymocytes.

Similar articles

Cited by

References

    1. Jones S. An overview of the basic helix-loop-helix proteins. Genome Biol (2004) 5:226. doi: 10.1186/gb-2004-5-6-226 - DOI - PMC - PubMed
    1. Kee BL. E and ID proteins branch out. Nat Rev Immunol (2009) 9:175–84. doi: 10.1038/nri2507 - DOI - PubMed
    1. Engel I, Murre C. The function of e- and id proteins in lymphocyte development. Nat Rev Immunol (2001) 1:193–9. doi: 10.1038/35105060 - DOI - PubMed
    1. Murre C. Helix–loop–helix proteins and the advent of cellular diversity: 30 years of discovery. Genes Dev (2019) 33:6–25. doi: 10.1101/gad.320663.118 - DOI - PMC - PubMed
    1. Wang D, Claus CL, Vaccarelli G, Braunstein M, Schmitt TM, Zúñiga-Pflücker JC, et al. . The basic helix-Loop-Helix transcription factor HEBAlt is expressed in pro-T cells and enhances the generation of T cell precursors. J Immunol (2006) 177:109–19. doi: 10.4049/jimmunol.177.1.109 - DOI - PubMed

Publication types

MeSH terms

Substances