

A novel signature to guide osteosarcoma prognosis and immune microenvironment: Cuproptosis-related lncRNA
- PMID: 35967366
- PMCID: PMC9373797
- DOI: 10.3389/fimmu.2022.919231
A novel signature to guide osteosarcoma prognosis and immune microenvironment: Cuproptosis-related lncRNA
Abstract
Objective: Osteosarcoma (OS) is a common bone malignancy with poor prognosis. We aimed to investigate the relationship between cuproptosis-related lncRNAs (CRLncs) and the survival outcomes of patients with OS.
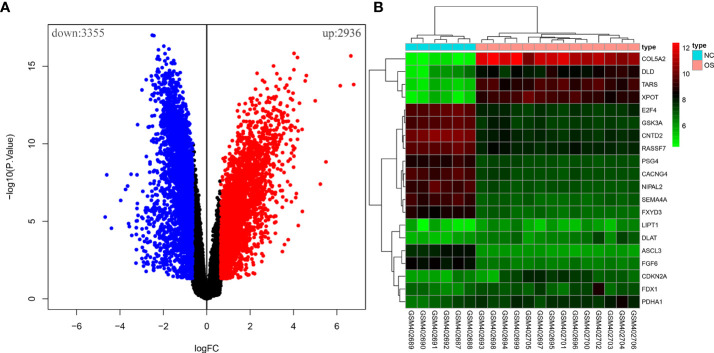
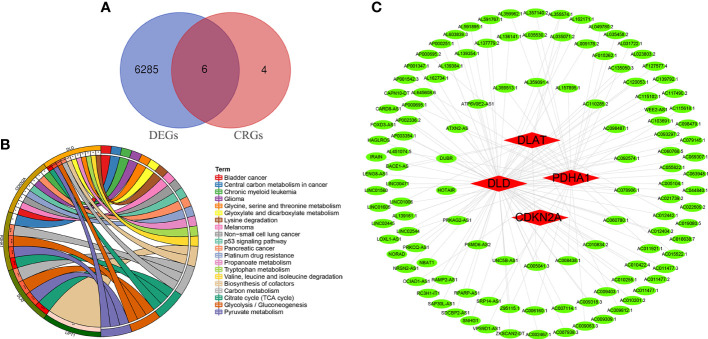
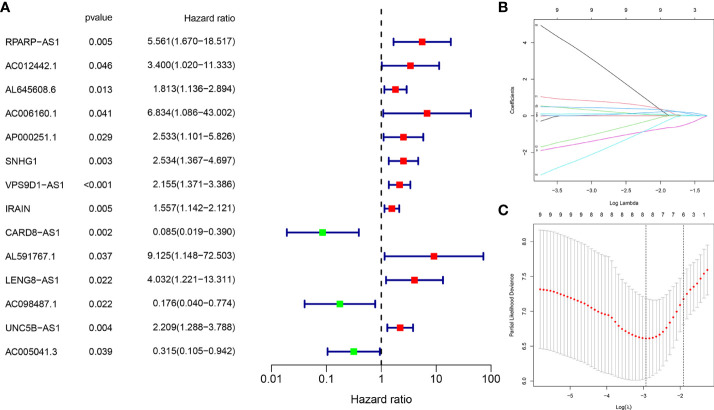
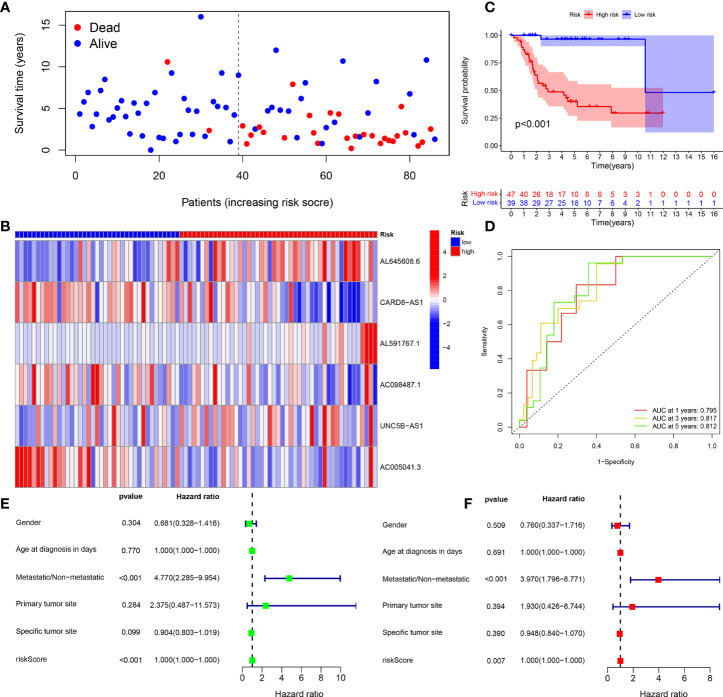
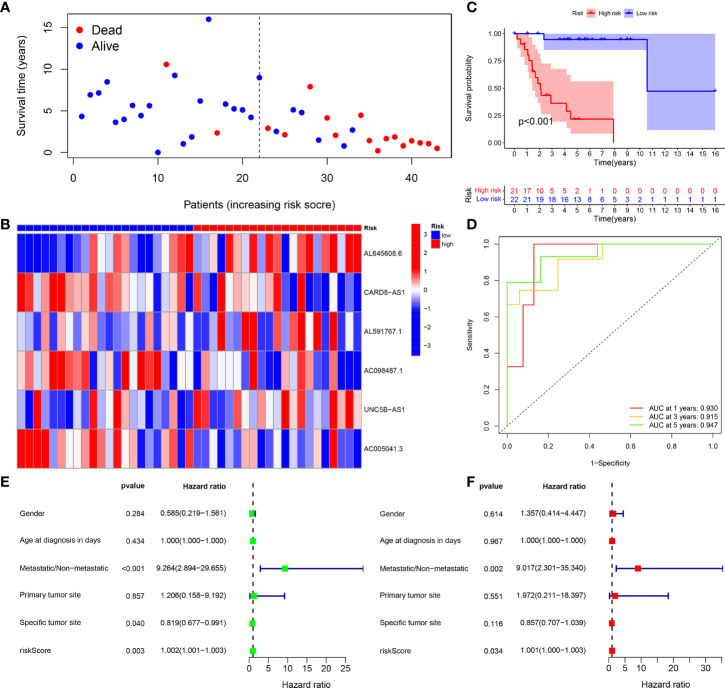
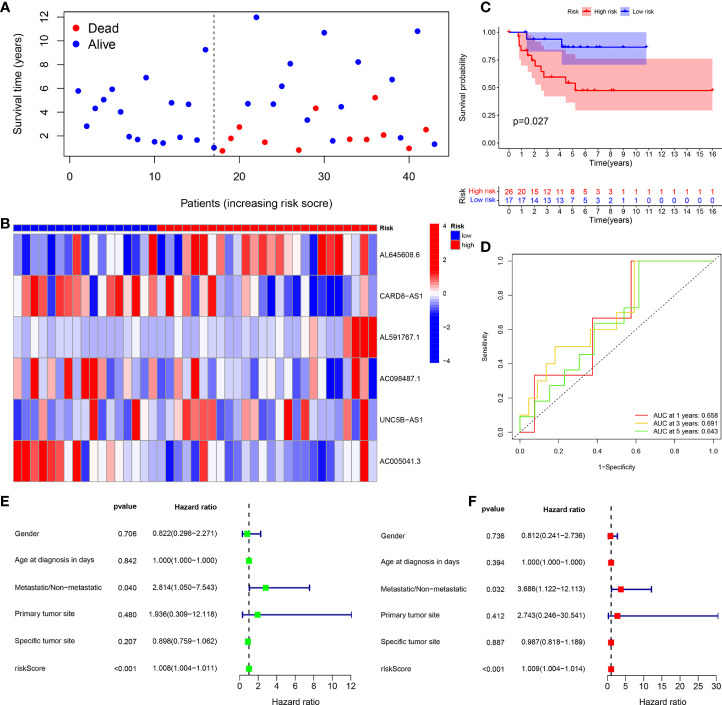
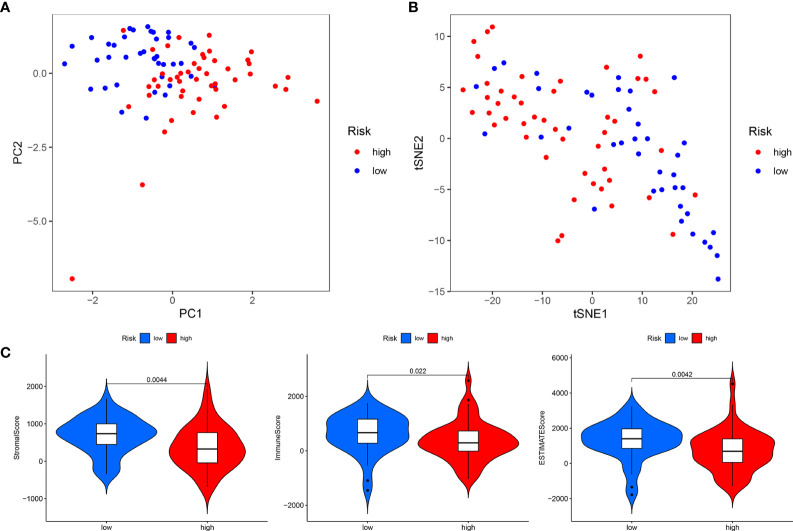
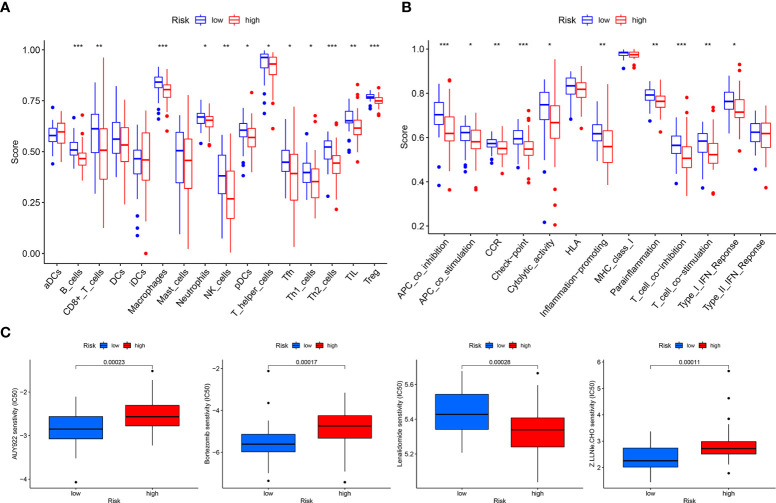
Methods: Transcriptome and clinical data of 86 patients with OS were downloaded from The Cancer Genome Atlas (TCGA). The GSE16088 dataset was downloaded from the Gene Expression Omnibus (GEO) database. The 10 cuproptosis-related genes (CRGs) were obtained from a recently published article on cuproptosis in Science. Combined analysis of OS transcriptome data and the GSE16088 dataset identified differentially expressed CRGs related to OS. Next, pathway enrichment analysis was performed. Co-expression analysis obtained CRLncs related to OS. Univariate COX regression analysis and least absolute shrinkage and selection operator (LASSO) regression analysis were used to construct the risk prognostic model of CRLncs. The samples were divided evenly into training and test groups to verify the accuracy of the model. Risk curve, survival, receiver operating characteristic (ROC) curve, and independent prognostic analyses were performed. Next, principal component analysis (PCA) and t-distributed stochastic neighbor embedding (t-SNE) analysis were performed. Single-sample gene set enrichment analysis (ssGSEA) was used to explore the correlation between the risk prognostic models and OS immune microenvironment. Drug sensitivity analysis identified drugs with potential efficacy in OS. Real-time quantitative PCR, Western blotting, and immunohistochemistry analyses verified the expression of CRGs in OS. Real-time quantitative PCR was used to verify the expression of CRLncs in OS.
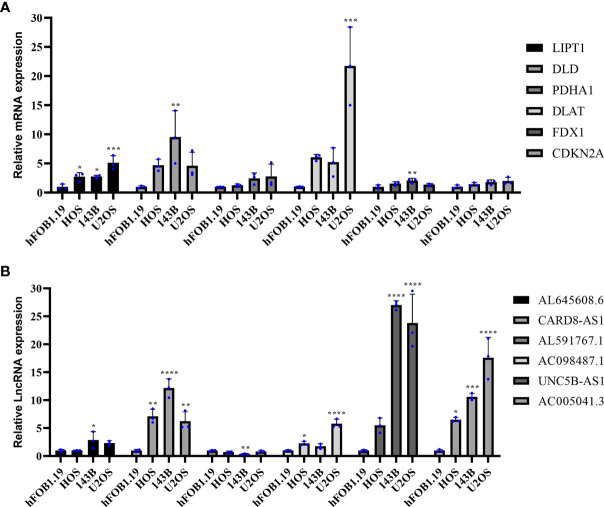
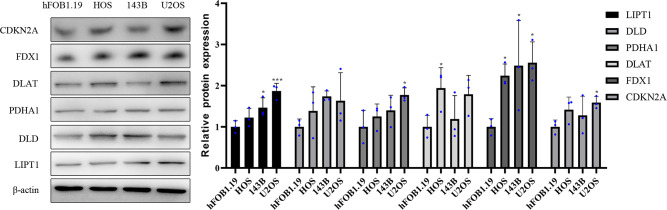
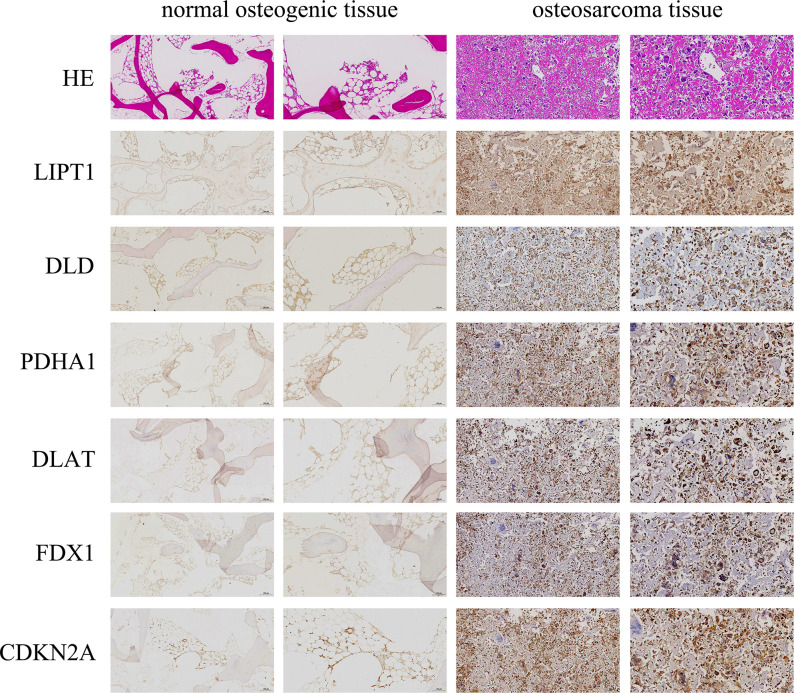
Results: Six CRLncs that can guide OS prognosis and immune microenvironment were obtained, including three high-risk CRLncs (AL645608.6, AL591767.1, and UNC5B-AS1) and three low-risk CRLncs (CARD8-AS1, AC098487.1, and AC005041.3). Immune cells such as B cells, macrophages, T-helper type 2 (Th2) cells, regulatory T cells (Treg), and immune functions such as APC co-inhibition, checkpoint, and T-cell co-inhibition were significantly downregulated in high-risk groups. In addition, we obtained four drugs with potential efficacy for OS: AUY922, bortezomib, lenalidomide, and Z.LLNle.CHO. The expression of LIPT1, DLAT, and FDX1 at both mRNA and protein levels was significantly elevated in OS cell lines compared with normal osteoblast hFOB1.19. The mRNA expression level of AL591767.1 was decreased in OS, and that of AL645608.6, CARD8-AS1, AC005041.3, AC098487.1, and UNC5B-AS1 was upregulated in OS.
Conclusion: CRLncs that can guide OS prognosis and the immune microenvironment and drugs that may have a potential curative effect on OS obtained in this study provide a theoretical basis for OS survival research and clinical decision-making.
Keywords: LncRNA; cuproptosis; immunity; osteosarcoma; prognosis.
Copyright © 2022 Yang, Zheng, Xu, Yuan, Aihaiti, Cai and Xu.
Conflict of interest statement
The authors declare that the research was conducted in the absence of any commercial or financial relationships that could be construed as a potential conflict of interest.
Figures
References
-
- Zhang D, Cui G, Sun C, Lei L, Lei L, Williamson RA, et al. Hypoxia promotes osteosarcoma cell proliferation and migration through enhancing platelet-derived growth factor-bb/platelet-derived growth factor receptor-beta axis. Biochem Biophys Res Commun (2019) 512(2):360–6. doi: 10.1016/j.bbrc.2019.03.040 - DOI - PubMed
MeSH terms
Substances
LinkOut - more resources
Full Text Sources