. 2022 Jul 29:13:847092.
doi: 10.3389/fimmu.2022.847092. eCollection 2022.

Peptide Centric Vβ Specific Germline Contacts Shape a Specialist T Cell Response

Affiliations

Peptide Centric Vβ Specific Germline Contacts Shape a Specialist T Cell Response

Yang Wang et al. Front Immunol. .

Abstract

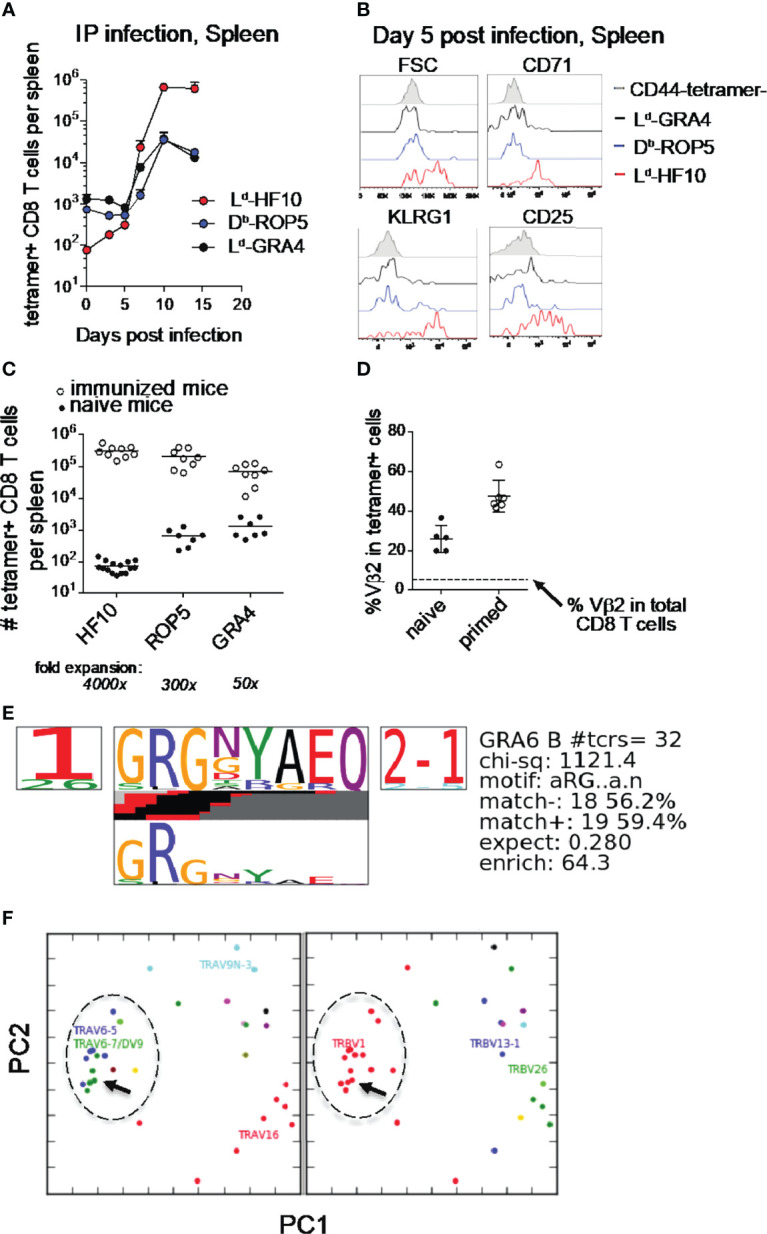
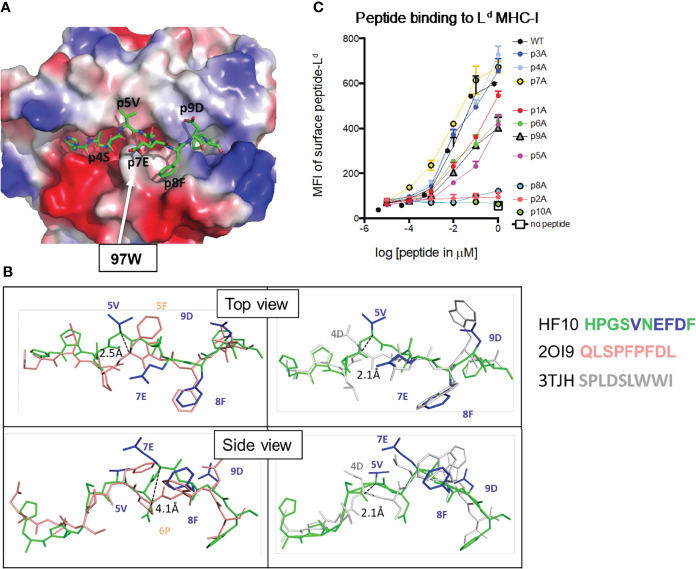
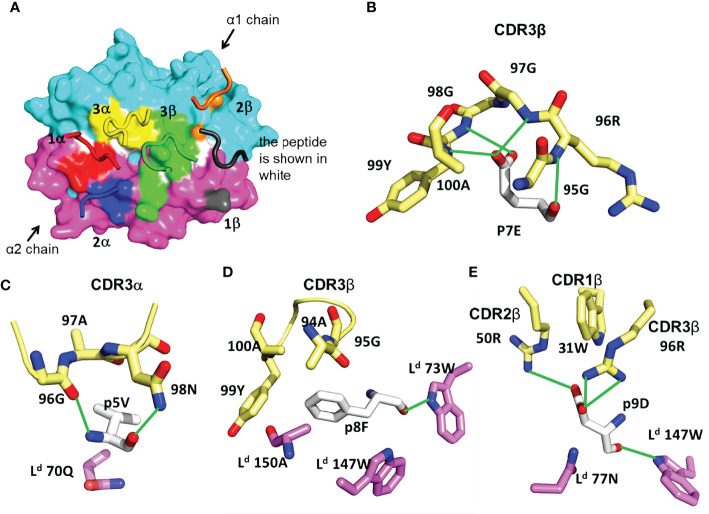
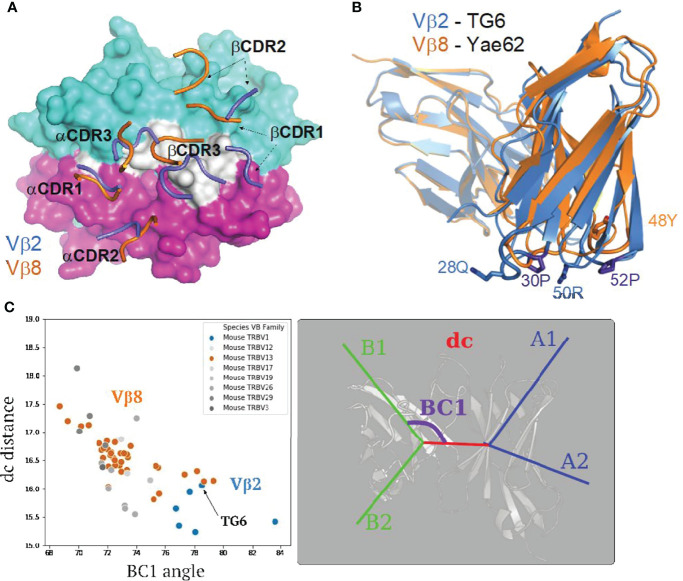
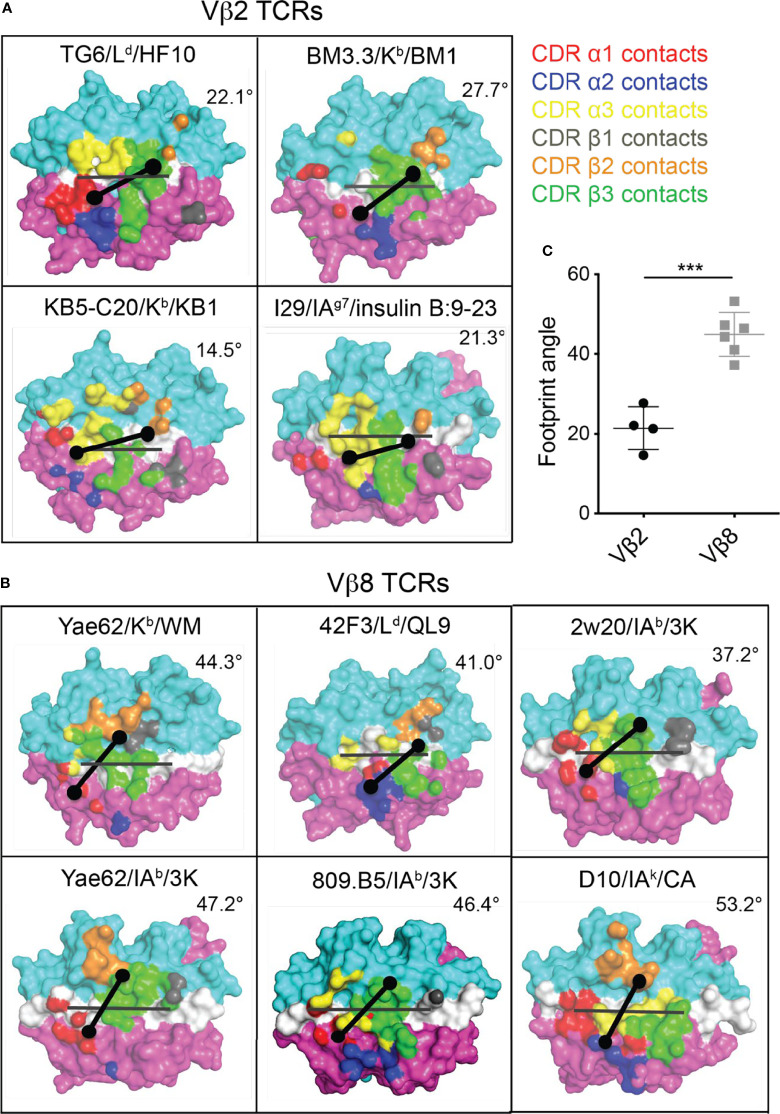
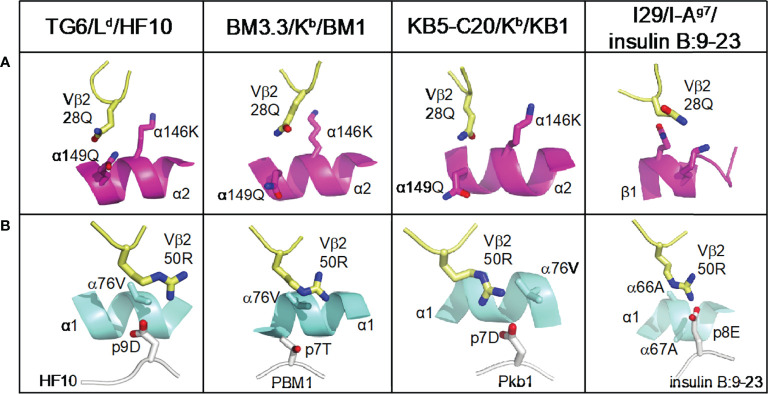
Certain CD8 T cell responses are particularly effective at controlling infection, as exemplified by elite control of HIV in individuals harboring HLA-B57. To understand the structural features that contribute to CD8 T cell elite control, we focused on a strongly protective CD8 T cell response directed against a parasite-derived peptide (HF10) presented by an atypical MHC-I molecule, H-2Ld. This response exhibits a focused TCR repertoire dominated by Vβ2, and a representative TCR (TG6) in complex with Ld-HF10 reveals an unusual structure in which both MHC and TCR contribute extensively to peptide specificity, along with a parallel footprint of TCR on its pMHC ligand. The parallel footprint is a common feature of Vβ2-containing TCRs and correlates with an unusual Vα-Vβ interface, CDR loop conformations, and Vβ2-specific germline contacts with peptides. Vβ2 and Ld may represent "specialist" components for antigen recognition that allows for particularly strong and focused T cell responses.

Keywords: MHC; TCR; elite controller; germline contacts; structure.


Conflict of interest statement

The authors declare that the research was conducted in the absence of any commercial or financial relationships that could be construed as a potential conflict of interest.

Figures

Figure 1
Figure 1
Characteristics of the Ld-HF10 specific T cell response. (A) T. gondii-specific CD8 T cells were quantified by pMHC tetramer staining and flow cytometry of splenocytes at different time points after intraperitoneal infection of F1 (B6xB6.C) mice. Fold change between naive and expanded T cells was calculated using the average number of tetramer+ cells in each population in naive mice (GRA6 = 74.4, ROP5: 654.9, GRA4: 1330). (B) Flow cytometric analysis of size (FSC or forward scatter) or expression of activation and effector markers (CD71, KLRG1, and CD25) on gated tetramer+ splenic CD8 T cells at day 5 post infection. (C) Mice were immunized with bone marrow-derived dendritic cells loaded with the indicated peptides. Expanded tetramer+ CD8 T cells were quantified by tetramer staining of splenocytes 7 days post immunization (open circles). Numbers of tetramer+ CD8 T cells in the spleen were quantified by tetramer enrichment of naïve mice and were used to calculate the fold expansion of each antigen-specific T cell population (closed circles). Statistical significance of differences in fold change between the three groups was calculated using Mann-Whitney tests. GRA6 vs. GRA4: p < 0.0001, GRA6 vs. ROP5: p < 0.0001, GRA4 vs. ROP5: p=0.0002. Statistical significance between tetramer+ T cell populations was calculated by two-way ANOVA. The interaction p-values are as follows: GRA6 vs. GRA4: p < 0.0001, GRA6 vs. ROP5: p < 0.0001, GRA4 vs. ROP5: p=0.99. (D) The frequency of Vβ2 usage amongst Ld-HF10 specific splenic CD8 T cells tetramer enriched from naïve mice or found in T. gondii-infected mice was determined by flow cytometry. Each dot represents an individual mouse and the dashed line indicates the frequency of Vβ2 amongst total splenic CD8 T cells (5.40%). (E, F) Ld-HF10 tetramer+ CD8 T cells were sorted from mice 3 weeks post infection and TCRα and TCRβ genes from individual T cells were sequenced as described (39). Clonal diversity in Ld-HF10 specific CD8 T cells was analyzed using the TCRdist algorithm (40). (E) Top-scoring CDR3β motif. Results of a CDR3 motif discovery algorithm are shown using a TCR logo that summarizes V and J usage, CDR3 amino acid enrichment, and inferred rearrangement structures. The bottom panel shows the motif enriched by calculating against a background dataset of non-epitope specific TCR sequences. (F) Principal components analysis (PCA) projection of the TCRdist landscape colored by Vα (left panel) and Vβ (right panel) gene usage. The groups of TCRs that correspond to the top scoring CDR3β motif are indicated with a dashed circle, and the TG6 TCR is indicated with an arrow.
Figure 2
Figure 2
Features of the antigenic HF10 peptide bound to H2-Ld. Soluble H2-Ld containing a covalently linked HF10 antigen peptide was crystallized and the structure was solved at 1.8 Å (Experimental Procedures and Supplementary Table S2 ). (A) The electrostatic surface charge of the Ld molecule (with bound HF10 peptide) is shown colored by the relative charge of the surface atoms (red - negative and blue - positive). A stick representation of the HF10 peptide is colored as: carbon, green; oxygen, red; nitrogen blue. The location of W97 was indicated by an arrow. (B) Conformation of the bound HF10 peptide (green with blue side chains) in comparison to other Ld-bound peptides. Peptides with a bend at p5 (HF10 and 2OI9 in pink) are on the left, and peptides with a bend at p6 (p7 for HF10) (HF10 and 3TJH in white) are on the right. See Movie S1. Additional Ld-bound peptides are shown in Supplementary Figure S2 . (C) H2-Ld binding to HF10 peptide alanine substitution variants. Flow cytometry surface expression (MFI) of Ld on TAP-deficient RMA-S.Ld cells incubated with increasing concentrations of the indicated HF10 or peptide variants. Data are representative of three independent assays.
Figure 3
Figure 3
Features of TG6 TCR bound to Ld-HF10 complex. (A) TCR footprint on the solvent-accessible surfaces of the Ld-HF10 complexes (Ld α1, cyan; Ld α2, magenta; peptide, white). The TCR CDR loops are colored as TCR footprint. Areas of TCR contact with pMHC (≤ 4.5Å) are colored as: CDR1α, red; CDR2α, blue; CDR3α, yellow; CDR1β, gray; CDR2β, orange; CDR3β green. (B-E), Interactions between TG6 CDRs and Ld-HF10. HF10 residues are shown in white carbon stick; residues on TG6 are shown in pale yellow carbon stick; residues of Ld are shown in magenta (α1) and cyan (α2) carbon stick; H-bonds and salt bridges are indicated by green lines. (B) Extensive contacts between TCR CDR3β and p7E of the HF10 peptide. (C) Residues of both TCR CDR3α and Ld contact HF10 p5V. (D) Hydrophobic stacking of TCR CDR3β and Ld with HF10 p8F. (E) Both TG6 CDR2β and CDR3β form a salt bridge to p9D. Ld also provides contacts. See Movie S2.
Figure 4
Figure 4
Structural differences between Vβ2 and Vβ8 containing TCRs lead to an altered footprint for pMHC binding. (A) A comparison of the positions of CDR loops from TG6 and YAe62 TCRs over their pMHC ligands. CDR loops from TG6 are shown in blue and Yae62 are in orange. (B) Ribbon diagrams of TG6 TCR (Vβ2) and YAe62 TCR (Vβ8) overlaid with their TCRα chains aligned (both Vα4 encoded by TRAV6). Note that there is a shift in the juxtaposition of TCRα and TCRβ domains that contributes to the shift in the position in the CDR loops of TCRα relative to TCRβ. In addition, proline residues in the CDR1 and CDR2 loops of Vβ2 lead to a further shift in the CDR1 and 2 loops away from the α1 helix of MHC and toward the peptide and α 2 helix of MHC-I (or β1 helix of MHC-II) See Movie S3. (C) TRangle parameters dc distance and BC1 angle for the TG6 TCR (indicated by arrow) compared to non-redundant TCR structures in the PDB. Vβ2 TCRs are shown in blue and Vβ8 TCRs are in orange. Right panel shows TRangle parameters used to define the Vα Vβ interface geometry superimposed over a ribbon diagram of TCR.
Figure 5
Figure 5
Footprint for binding of Vβ2 and Vβ8 containing TCRs to pMHC. The TCR footprints for four different Vβ2 TCR/pMHC complexes (A) and six different Vβ8 TCR/pMHC complexes (B) are shown, along with footprint angles, calculated based on a vector for the peptide (grey line) and a vector for the TCR-pMHC contact regions (black line) as described in the text. The center of the TCRα and TCRβ footprints are indicated by dots. Structures are: TG6 TCR binding to Ld-HF10 (PDB: 6X31); BM3.3 TCR binding to Kb-pBM1 (PDB: 1FO0); KB5-C20 TCR binding to Kb-pKB1 (PDB: 1JK2); TCR I29 binding to IAg7-insulin B:9-23 (PDB: 5JZ4); TCR Yae62 binding to Kb-pWM (PDB: 3RGV);TCR 42F3 to Ld-pCPA12 (PDB: 4N5E); TCR 2w20 to IAb-3k (PDB: 3C6L); TCR Yae62 to IAb-3k (PDB: 3C60); TCR ANI2.3 to DR52c-pHIR (PDB: 4H1L); TCR D10 to IAk-pCA (PDB: 1D9K). (C) Summary of all calculated Vβ2 and Vβ8 TCR footprint angles. Statistical significance was determined by a t-test (***p < 0.001).
Figure 6
Figure 6
Conserved germline contacts of Vβ2 with pMHC. All Vβ2 TCR/pMHC structures are superposed and presented in the same view. Atoms are shown in CPK coloring. Vβ2 residues (28Q and 50R) are shown as pale yellow sticks. (A) The position of Vβ2 28Q from Vβ2 containing TCRs is shown interacting with the MHC α2 helices (or β1 helix from MHC-II) shown in magenta ribbon diagram. (B) The position of Vβ2 50R with pMHC contact from the same structures as in (A). MHC α1 helices are shown in cyan ribbon diagram, peptides are shown in white cartoon, and the residues that interact with TCR are shown as white sticks. Protein Data Bank identifiers are: Ld-HF10 (PDB: 6X31); BM3.3 TCR with Kb-pBM1 (PDB: 1FO0); KB5 TCR with Kb-Pkb1 (PDB: 1JK2); I29 with IAg7-insulin B:9-23 (PDB: 5JZ4).

References

    1. Hennecke J, Wiley DC. T Cell Receptor-MHC Interactions Up Close. Cell (2001) 104(1):1–4. doi: 10.1016/s0092-8674(01)00185-4 - DOI - PubMed
    1. La Gruta NL, Gras S, Daley SR, Thomas and J. Rossjohn PG. Understanding the Drivers of MHC Restriction of T Cell Receptors. Nat Rev Immunol (2018) 18(7):467–78. doi: 10.1038/s41577-018-0007-5 - DOI - PubMed
    1. Adams JJ, Narayanan S, Liu B, Birnbaum ME, Kruse AC, Bowerman NA, et al. . T Cell Receptor Signaling is Limited by Docking Geometry to Peptide-Major Histocompatibility Complex. Immunity (2011) 35(5):681–93. doi: 10.1016/j.immuni.2011.09.013 - DOI - PMC - PubMed
    1. Marrack P, Scott-Browne JP, Dai S, Gapin and J.W. Kappler L. Evolutionarily Conserved Amino Acids That Control TCR-MHC Interaction. Annu Rev Immunol (2008) 26:171–203. doi: 10.1146/annurev.immunol.26.021607.090421 - DOI - PMC - PubMed
    1. Rossjohn J, Gras S, Miles JJ, Turner SJ, Godfrey and J. McCluskey DI. T Cell Antigen Receptor Recognition of Antigen-Presenting Molecules. Annu Rev Immunol (2015) 33:169–200. doi: 10.1146/annurev-immunol-032414-112334 - DOI - PubMed

MeSH terms