. 2022 Jul 27:13:934083.
doi: 10.3389/fimmu.2022.934083. eCollection 2022.

Classification of colon adenocarcinoma based on immunological characterizations: Implications for prognosis and immunotherapy

Affiliations

Classification of colon adenocarcinoma based on immunological characterizations: Implications for prognosis and immunotherapy

Midie Xu et al. Front Immunol. .

Abstract

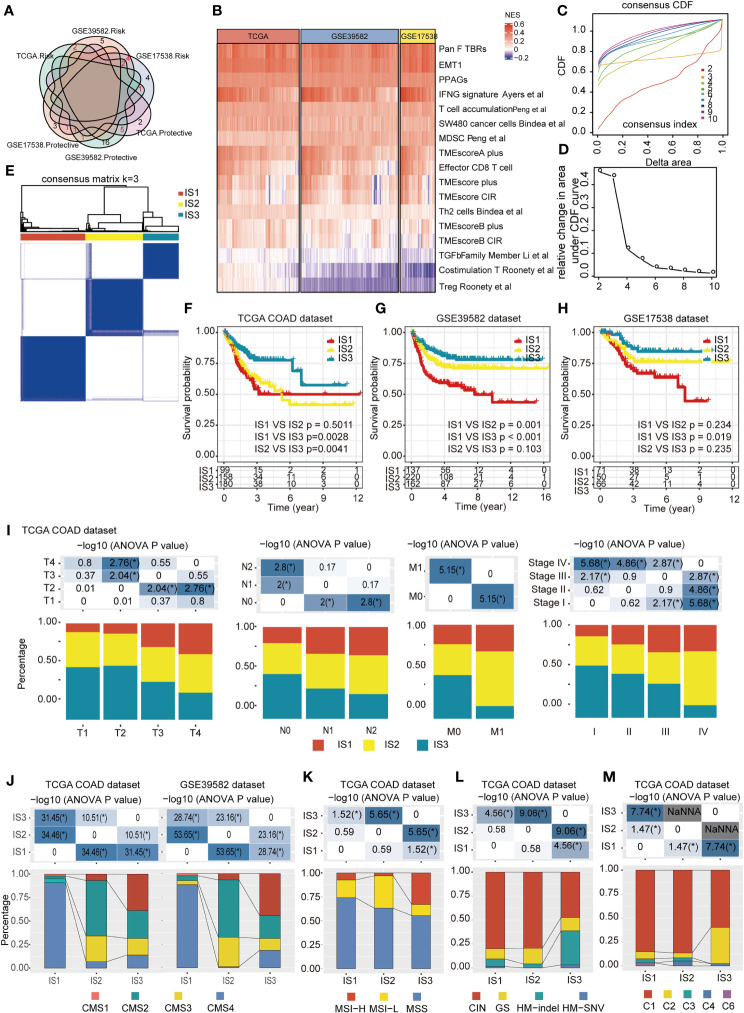
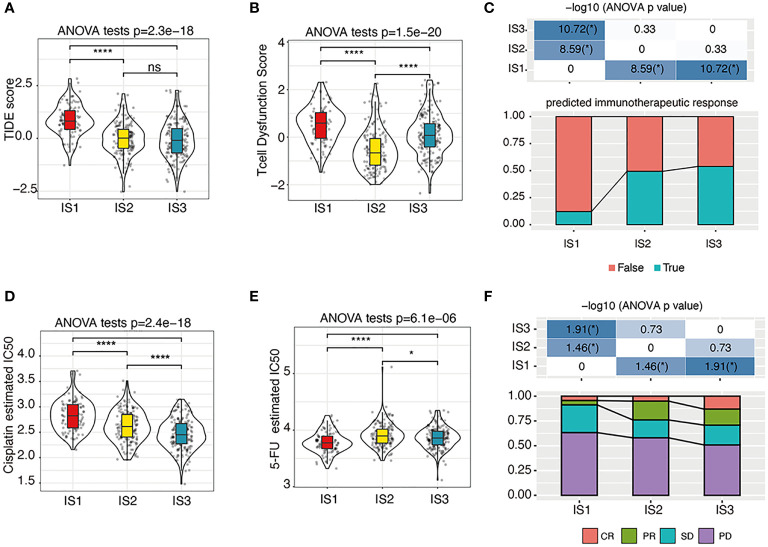
Accurate immune molecular typing is pivotal for screening out patients with colon adenocarcinoma (COAD) who may benefit from immunotherapy and whose tumor microenvironment (TME) was needed for reprogramming to beneficial immune-mediated responses. However, little is known about the immune characteristic of COAD. Here, by calculating the enrichment score of immune characteristics in three online COAD datasets (TCGA-COAD, GSE39582, and GSE17538), we identified 17 prognostic-related immune characteristics that overlapped in at least two datasets. We determined that COADs could be stratified into three immune subtypes (IS1-IS3), based on consensus clustering of these 17 immune characteristics. Each of the three ISs was associated with distinct clinicopathological characteristics, genetic aberrations, tumor-infiltrating immune cell composition, immunophenotyping (immune "hot" and immune "cold"), and cytokine profiles, as well as different clinical outcomes and immunotherapy/therapeutic response. Patients with the IS1 tumor had high immune infiltration but immunosuppressive phenotype, IS3 tumor is an immune "hot" phenotype, whereas those with the IS2 tumor had an immune "cold" phenotype. We further verified the distinct immune phenotype of IS1 and IS3 by an in-house COAD cohort. We propose that the immune subtyping can be utilized to identify COAD patients who will be affected by the tumor immune microenvironment. Furthermore, the ISs may provide a guide for personalized cancer immunotherapy and for tumor prognosis.

Keywords: colon adenocarcinoma; immune characteristics; immune subtype analysis; prognosis; therapy response.


Conflict of interest statement

The authors declare that the research was conducted in the absence of any commercial or financial relationships that could be construed as a potential conflict of interest.

Figures

Figure 1
Figure 1
Study design and workflow of the present study. (A). Four databases of COAD RNA-sequencing or gene microarray data were used as test or validation cohorts; (B). RNA expression data were quantified with immune characteristics by univariate Cox regression analysis and hierarchically clustered into three subtypes; (C). Mutation, clinical outcomes, immune characteristics, and enriched molecules were compared among the three subtypes. In addition, correlations between subtypes and responses to immunotherapy/chemotherapy were evaluated.
Figure 2
Figure 2
Identification of potential immune subtypes of COAD. (A). Overlapping prognostic immune characteristics among TCGA-COAD, GSE39582, and GSE17538 cohorts; the lines correspond to different gene sets in each dataset; red numbers represent the intersection genes of different datasets. (B) The distribution of 17 immune characteristics among three cohorts; (C, D). Cumulative distribution function (CDF) curve (C) and (D) delta area showed the stability of different cluster numbers in the consensus clustering result by using the enrichment score of the 17 immune characteristics. The consensus CDF diagram allows us to determine at what number of clusters, k, the CDF reaches an approximate maximum; thus, consensus and cluster confidence are at a maximum at this k (Please See Xue.et al, PMID: 19351533). In this manuscript, we set the k value = 3. (E). Sample clustering heat map of the 437 samples in TCGA-COAD cohort. (F–H). Kaplan–Meier curves with log-rank test showing DFS of ISs in TCGA-COAD (F), GSE39582 (G) and GSE17538 (H) cohorts. (I). Distribution of IS1-IS3 among the indicated clinicopathological characteristics in TCGA-COAD cohort. (J). Distribution of IS1-IS3 among CMS classification in TCGA-COAD and GSE39582 cohort. (K). Distribution of IS1–IS3 among patients with different microsatellite instability (MSI) statuses; IS2 and IS3 had the highest percent of patients with MSI-L and MSI-H subtypes, respectively. (L). Distribution of IS1–IS3 among TCGA mutation classification; IS1 and IS2 are mainly composed of the CIN subtype, while IS3 showed more relevance with the HM-indel and HM-SNV subtype. (M). Distribution of IS1–IS3 among TCGA immune subtypes; the IS1 and IS2 subtypes are mainly inclined to C1 subtypes, and the C6 subtype is mainly distributed within IS1, while the percent of C2 subtypes in IS3 was higher than that in IS1 and IS2. * P < 0.01, ** P < 0.001,*** P < 0.0001, and **** P < 0.00001.
Figure 3
Figure 3
Distribution of immune-related molecular characteristics among ISs in TCGA-COAD and FUSCC cohorts (A, B). Differential expression of chemokines (A) or chemokine receptors (B) among the COAD immune subtypes in TCGA-COAD cohort. CCL4, CCL5, CXCL9, CXCL10, CXCR3, CXCR4, and CXCR6 are highlighted in pink. The top and bottom of the box are the upper quartile (Q3) and the lower quartile (Q1) of the data, respectively. The solid line in the box represents the median. The whiskers represent the maximum and minimum values of this group of data. The Kruskal–Wallis test was used to assess for significant differences. ns not significant, *P < 0.01, **P < 0.001, ***P < 0.0001, and ****P < 0.00001. (C). Differential expression of immune checkpoint-related genes among the COAD immune subtypes in TCGA-COAD cohort. The top and bottom of the box are the upper quartile (Q3) and the lower quartile (Q1) of the data, respectively. The solid line in the box represents the median. The whiskers represent the maximum and minimum values of this group of data. The Kruskal–Wallis test was used to assess for significant differences. ns not significant, *P < 0.01, **P < 0.001, ***P < 0.0001, and ****P < 0.00001. (D–G). Differential expression of cGAS (D), TMEM173 (E), TBK1 (F), and IRF3 (G) among the COAD immune subtypes in TCGA-COAD cohort. We used the Kruskal–Wallis test and Wilcox test to compare the significance among the three groups and pairwise comparison between groups, respectively. The solid black line in the box represents the median, and the black box in the violin plot represents the quartile range. The black vertical line running through the violin chart represents the interval from the minimum value to the maximum value, respectively. ns not significant, *P < 0.01, **P < 0.001, ***P < 0.0001, and ****P < 0.00001. (H–J). The estimated IFN-γ level (H), CYT level (I), and angiogenesis level (J) among the COAD immune subtypes in TCGA-COAD cohort. We used Kruskal–Wallis test and Wilcoxon test to compare the significance among the three groups and pairwise comparison between groups, respectively. The solid black line in the box represents the median, and the inner black box in the violin plot represents the quartile range. The black vertical line running through the violin chart represents the interval from the minimum value to the maximum value, respectively. ns not significant, *P < 0.01, **P < 0.001, ***P < 0.0001, and ****P < 0.00001. (K). Representative IHC result of IFN-γ, GZMB, and CD31 in dMMR and pMMR subtypes in the FUSCC cohort. The box area is magnified in the right panel. Scale bars: 100 µm (left panel) and 20 µm (right panel). (L). Scatter plots show the difference of IFN-γ, GZMB, and CD31 in dMMR and pMMR subtypes in the FUSCC cohort. Unpaired t-test. Data are shown as mean ± SD. ***P < 0.0001.
Figure 4
Figure 4
Association between immune subtypes and COAD-related tumor biomarkers in TCGA-COAD dataset (A). The estimated proportion of immune cell infiltration among immune subtypes. CD8 T cell is highlighted in pink. The top and bottom of the box are the upper quartile (Q3) and the lower quartile (Q1) of the data, respectively. The solid black line in the box represents the median. The whiskers represent the maximum and minimum values of this group of data. The Kruskal–Wallis test was used to assess for significant differences. ns, not significant, *P < 0.01, **P < 0.001, ***P < 0.0001, and ****P < 0.00001. (B) Heat map for the estimated proportions of immune cells in the samples among immune subtypes. CD8+ T cell is highlighted in pink and significantly higher in IS3 subtypes. (C, D). The proportions of StromalScore (C) or ImmuneScore (D) among immune subtypes in TCGA-COAD cohorts. IS1 has the highest relative proportion of stromal cells in TME, while IS2 has the lowest relative proportion of immune cells. We used the Kruskal–Wallis test and Wilcoxon test to compare the significance among the three groups and pairwise comparison between groups, respectively. The solid black line in the box represents the median, and the inner black box in the violin plot represents the quartile range. The black vertical line running through the violin chart represents the interval from the minimum value to the maximum value, respectively. ns, not significant, *P < 0.01, **P < 0.001, ***P < 0.0001, and ****P <0.00001.
Figure 5
Figure 5
Distribution of immune cell characteristics and inflammation characteristics among ISs. (A, B). Heat map (A) or boxplot (B) show the differential enrichment scores of 28 immune cell signatures among immune subtypes in TCGA-COAD cohorts. Activated CD4T, CD8T cells (highlighted with orange) are predominantly infiltrated in the IS3 subtype, while regulated T cells and MDSC cells (both are immunosuppressive cells, highlighted in blue) are predominantly infiltrated in the IS1 subtype. The top and bottom of the box are the upper quartile (Q3) and the lower quartile (Q1) of the data, respectively. The solid line in the box represents the median. The whiskers represent the maximum and minimum values of this group of data. The Kruskal–Wallis test was used to assess for significant differences. n.s, not significant, *P < 0.01, **P < 0.001, ***P < 0.0001, and ****P < 0.00001. (C). Heat map for the expression level of inflammation-related genes in each patient among immune subtypes in TCGA-COAD cohorts. Marker genes are highlighted in orange. (D). Differential enrichment scores of all seven inflammation-related metagenes among immune subtypes in TCGA-COAD cohorts. The IS3 subtype has the highest enrichment scores with LCK, MHC-I, MHC-II, and STAT1 gene clusters. The top and bottom of the box are the upper quartile (Q3) and the lower quartile (Q1) of the data, respectively. The solid line in the box represents the median. The whiskers represent the maximum and minimum values of this group of data. The Kruskal–Wallis test was used to assess for significant differences. ns, not significant, *P < 0.01 and ****P < 0.00001.
Figure 6
Figure 6
The immunotherapy/chemotherapy response of each IS. (A–C). The estimated TIDE score (A), T-cell dysfunction scores (B), and predicted immunotherapeutic response statues (C) among immune subtypes. We used the Kruskal–Wallis test and Wilcoxon test to compare the significance among the three groups and pairwise comparison between groups, respectively. The solid black line in the box is the median, and the inner black box in the violin plot represents the quartile range. The black vertical line running through the violin chart represents the interval from the minimum value to the maximum value, respectively. n.s, not significant, *P < 0.01 and ****P < 0.00001. (D, E). The predicted cisplatin (D) and 5-FU (E) chemotherapeutic response statues among immune subtypes. We used the Kruskal–Wallis test and Wilcoxon test to compare the significance among the three groups and pairwise comparison between groups, respectively. The solid black line in the box is the median, and the inner black box in the violin plot represents the quartile range. The black vertical line running through the violin chart represents the interval from the minimum value to the maximum value, respectively. n.s, not significant, *P < 0.01 and ****P < 0.00001. (F). The response statues among immune subtypes in the GSE72970 cohort. PR, partial response; CR, complete response; SD, stable disease; PD, progressive disease. *P < 0.01.
Figure 7
Figure 7
Identification of immune gene co-expression modules of COAD. (A) Dendrogram of all differentially expressed genes clustered based on a dissimilarity measure. (B). Gene numbers in each module. (C–E). Evaluation of the distribution of these 22 modules in each clinicopathological feature and immune subtype (C). The brown module was positively correlated with IS1 (D) and negatively correlated with IS2, while the darkolivegreen module was negatively correlated with IS2 and positively correlated with IS3 (E).(F, G). Dot plot showing top 10 gene ontology biological processes in the brown (F) and darkolivegreen (G) module. (H). Protein–protein interaction network of 12 DFS-related hub genes: AEBP1, CLEC14A, COL5A1, COL6A2, ITGA4, PDGFRB, EFEMP2, MMRN2, MRC2, THY1, and TNS1. (I). Forest plot of the univariate Cox regression analyses for the prognosis value of the indicated 12 genes in TCGA-COAD cohort.

References

    1. Siegel RL, Miller KD, Fuchs HE, Jemal A. Cancer statistics, 2021. CA Cancer J Clin (2021) 71(1):7–33. doi: 10.3322/caac.21654 - DOI - PubMed
    1. Siegel RL, Miller KD, Goding Sauer A, Fedewa SA, Butterly LF, Anderson JC, et al. . Colorectal cancer statistics, 2020. CA Cancer J Clin (2020) 70(3):145–64. doi: 10.3322/caac.21601 - DOI - PubMed
    1. Sung H, Ferlay J, Siegel RL, Laversanne M, Soerjomataram I, Jemal A, et al. . Global cancer statistics 2020: GLOBOCAN estimates of incidence and mortality worldwide for 36 cancers in 185 countries. CA Cancer J Clin (2021) 71(3):209–49. doi: 10.3322/caac.21660 - DOI - PubMed
    1. Dekker E, Tanis PJ, Vleugels JLA, Kasi PM, Wallace MB. Colorectal cancer. Lancet. (2019) 394(10207):1467–80. doi: 10.1016/s0140-6736(19)32319-0 - DOI - PubMed
    1. Weiden J, Tel J, Figdor CG. Synthetic immune niches for cancer immunotherapy. Nat Rev Immunol (2018) 18(3):212–9. doi: 10.1038/nri.2017.89 - DOI - PubMed

Publication types

LinkOut - more resources