

Elevated Foxp3+ double-negative T cells are associated with disease progression during HIV infection
- PMID: 35967422
- PMCID: PMC9365964
- DOI: 10.3389/fimmu.2022.947647
Elevated Foxp3+ double-negative T cells are associated with disease progression during HIV infection
Abstract
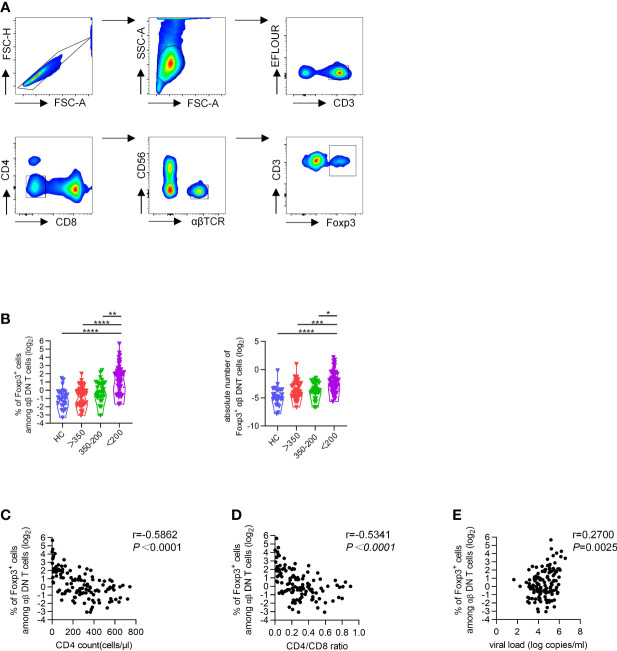
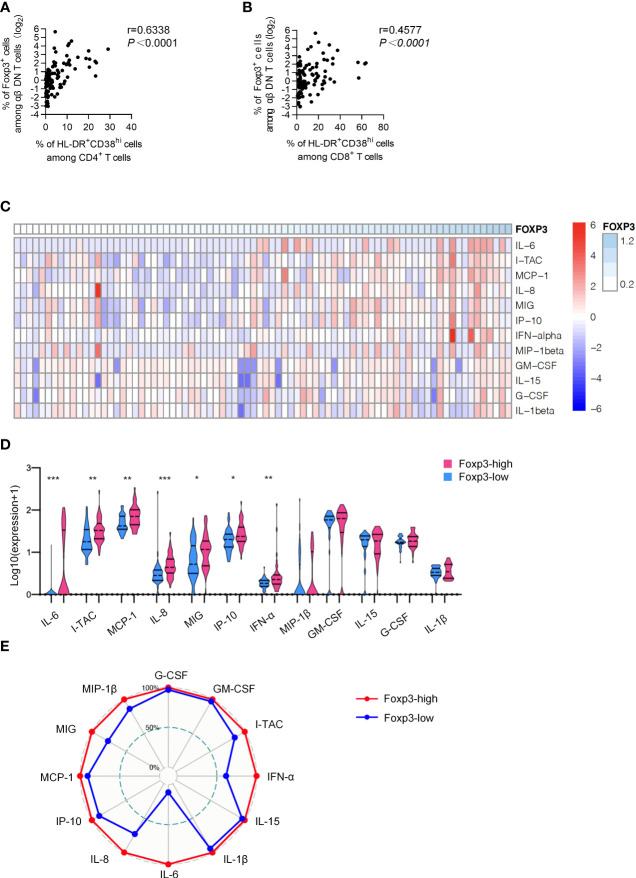
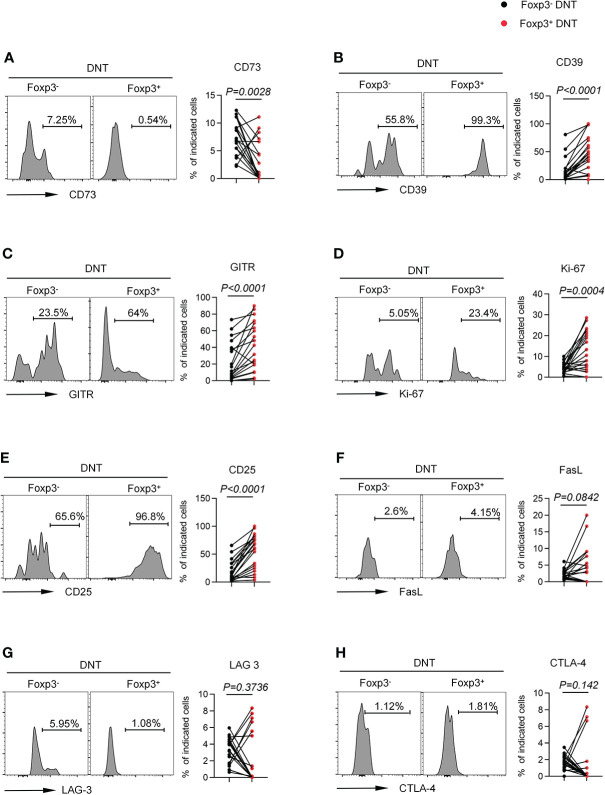
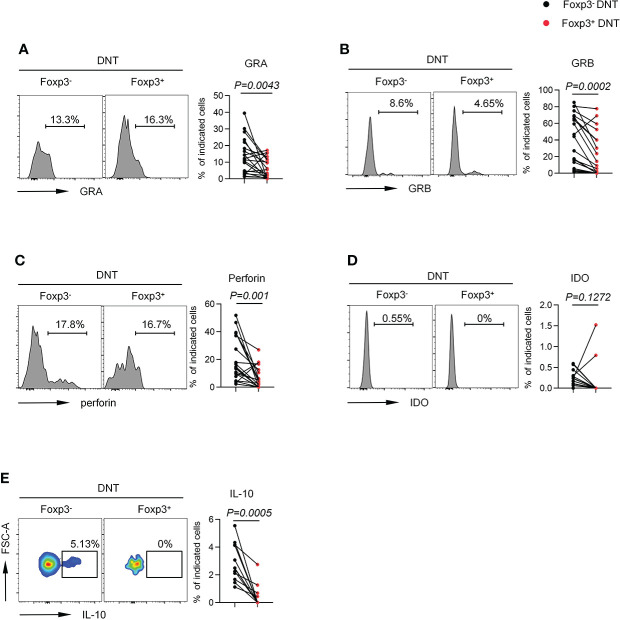
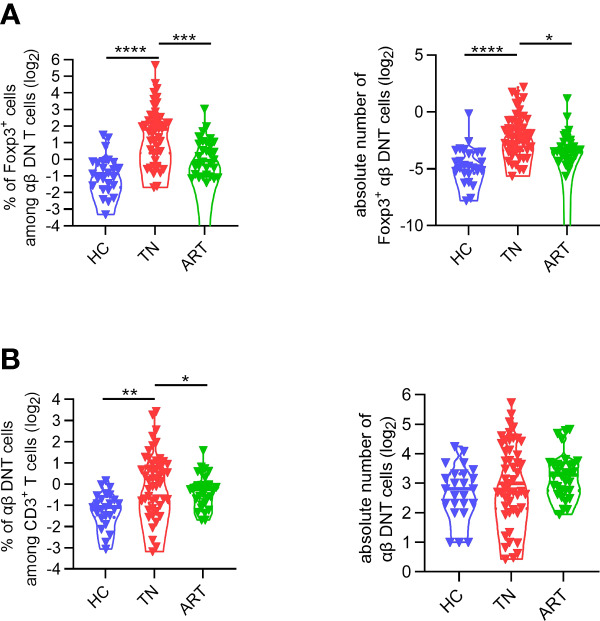
Persistent immune activation, which occurs during the whole course of HIV infection, plays a pivotal role in CD4+ T cells depletion and AIDS progression. Furthermore, immune activation is a key factor that leads to impaired immune reconstitution after long-term effective antiretroviral therapy (ART), and is even responsible for the increased risk of developing non-AIDS co-morbidities. Therefore, it's imperative to identify an effective intervention targeting HIV-associated immune activation to improve disease management. Double negative T cells (DNT) were reported to provide immunosuppression during HIV infection, but the related mechanisms remained puzzled. Foxp3 endows Tregs with potent suppressive function to maintain immune homeostasis. However, whether DNT cells expressed Foxp3 and the accurate function of these cells urgently needed to be investigated. Here, we found that Foxp3+ DNT cells accumulated in untreated people living with HIV (PLWH) with CD4+ T cell count less than 200 cells/µl. Moreover, the frequency of Foxp3+ DNT cells was negatively correlated with CD4+ T cell count and CD4/CD8 ratio, and positively correlated with immune activation and systemic inflammation in PLWH. Of note, Foxp3+ DNT cells might exert suppressive regulation by increased expression of CD39, CD25, or vigorous proliferation (high levels of GITR and ki67) in ART-naive PLWH. Our study underlined the importance of Foxp3+ DNT cells in the HIV disease progression, and suggest that Foxp3+ DNT may be a potential target for clinical intervention for the control of immune activation during HIV infection.
Keywords: Foxp3; HIV; double-negative T cell; immune activation; immune regulation.
Copyright © 2022 Zhang, Wei, Wang, Du, Wang, Li, Jiang, Zhang, Chen, Deng, Song, Chen, Wu, Xiao, Liang, Zhao and Kong.
Conflict of interest statement
The authors declare that the research was conducted in the absence of any commercial or financial relationships that could be construed as a potential conflict of interest.
Figures
Similar articles
-
Decreased CD73+ Double-Negative T Cells and Elevated Level of Soluble CD73 Correlated With and Predicted Poor Immune Reconstitution in HIV-Infected Patients After Antiretroviral Therapy.Front Immunol. 2022 Apr 4;13:869286. doi: 10.3389/fimmu.2022.869286. eCollection 2022. Front Immunol. 2022. PMID: 35444646 Free PMC article.
-
Increased frequency of Foxp3 + CD8 + T cells is associated with disease progression during HIV infection.AIDS. 2025 Jul 1;39(8):946-956. doi: 10.1097/QAD.0000000000004185. Epub 2025 Mar 19. AIDS. 2025. PMID: 40116077
-
Increased levels of Foxp3+CD4+NKT-like cells are associated with HIV disease progression.Clin Immunol. 2025 Sep;278:110533. doi: 10.1016/j.clim.2025.110533. Epub 2025 May 27. Clin Immunol. 2025. PMID: 40441400
-
Thymic function in HIV-infection.Dan Med J. 2013 Apr;60(4):B4622. Dan Med J. 2013. PMID: 23651726 Review.
-
Involvement of regulatory T cells in HIV immunopathogenesis.Curr HIV Res. 2010 Jun;8(4):340-6. doi: 10.2174/157016210791208613. Curr HIV Res. 2010. PMID: 20353390 Review.
Cited by
-
Association between gut microbiota in HIV-infected patients and immune reconstitution following antiretroviral therapy (ART).BMC Infect Dis. 2025 May 6;25(1):666. doi: 10.1186/s12879-025-10995-3. BMC Infect Dis. 2025. PMID: 40329177 Free PMC article.
-
Host immunity associated with spontaneous suppression of viremia in therapy-naïve young rhesus macaques following neonatal SHIV infection.J Virol. 2023 Nov 30;97(11):e0109423. doi: 10.1128/jvi.01094-23. Epub 2023 Oct 24. J Virol. 2023. PMID: 37874153 Free PMC article.
-
Double-Negative T-Cells during Acute Human Immunodeficiency Virus and Simian Immunodeficiency Virus Infections and Following Early Antiretroviral Therapy Initiation.Viruses. 2024 Oct 14;16(10):1609. doi: 10.3390/v16101609. Viruses. 2024. PMID: 39459942 Free PMC article.
References
MeSH terms
Substances
LinkOut - more resources
Full Text Sources
Medical
Research Materials