

Investigation of the causal etiology in a patient with T-B+NK+ immunodeficiency
- PMID: 35967429
- PMCID: PMC9372720
- DOI: 10.3389/fimmu.2022.928252
Investigation of the causal etiology in a patient with T-B+NK+ immunodeficiency
Abstract
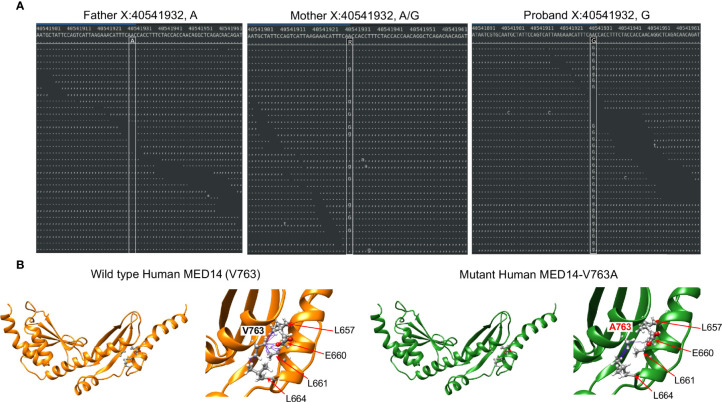
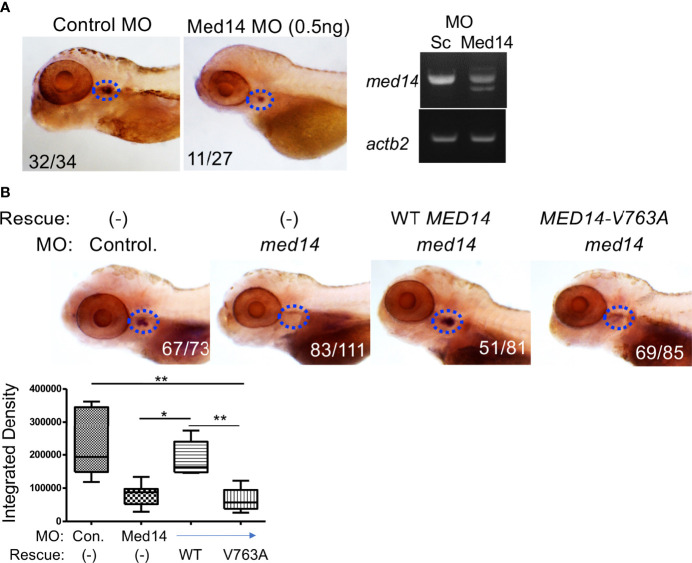
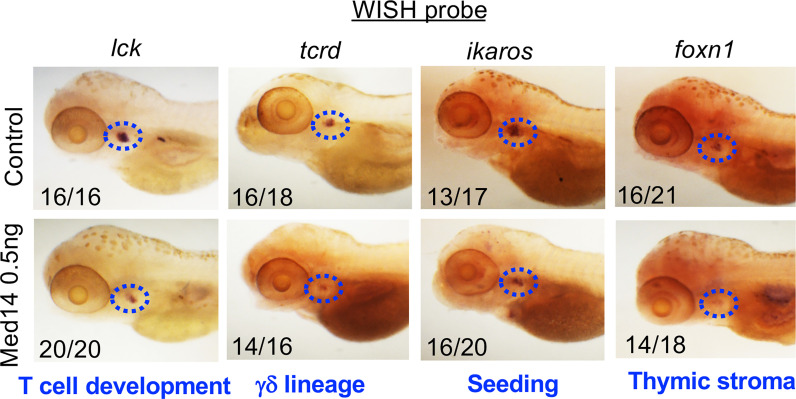
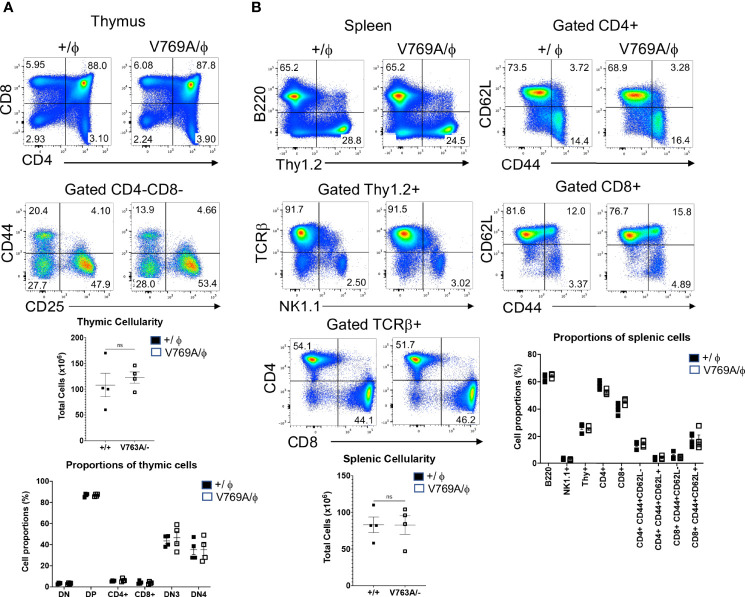
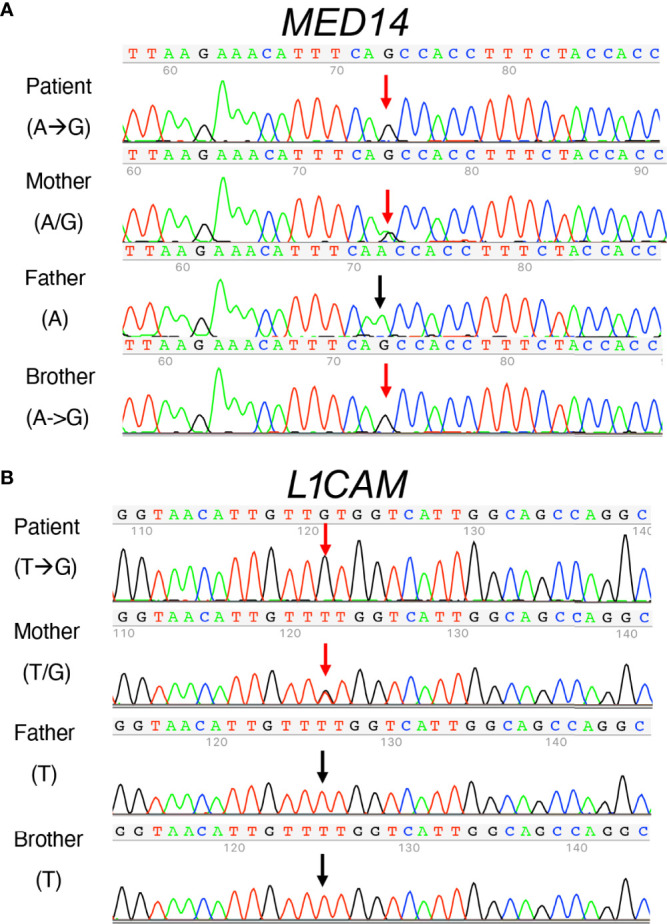
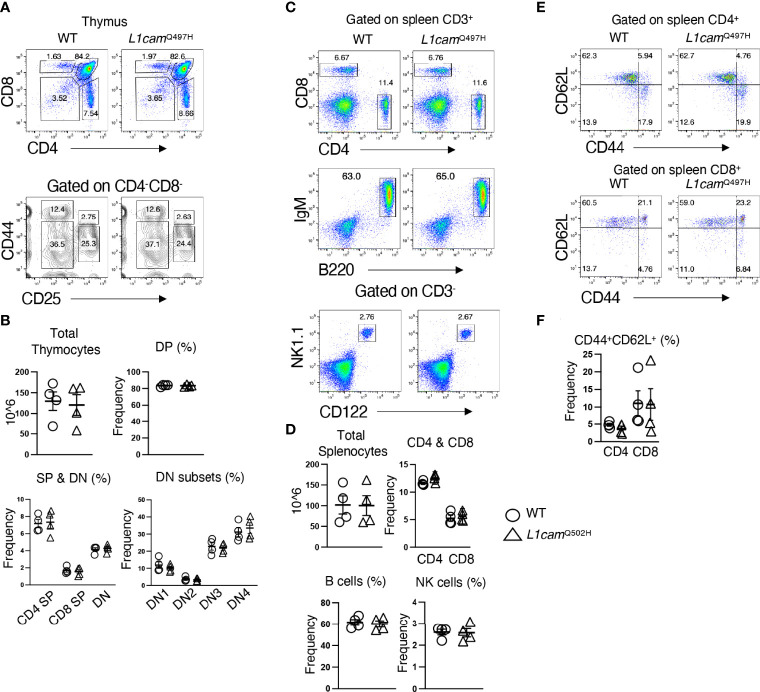
Newborn screening for severe combined immunodeficiency (SCID) has not only accelerated diagnosis and improved treatment for affected infants, but also led to identification of novel genes required for human T cell development. A male proband had SCID newborn screening showing very low T cell receptor excision circles (TRECs), a biomarker for thymic output of nascent T cells. He had persistent profound T lymphopenia, but normal numbers of B and natural killer (NK) cells. Despite an allogeneic hematopoietic stem cell transplant from his brother, he failed to develop normal T cells. Targeted resequencing excluded known SCID genes; however, whole exome sequencing (WES) of the proband and parents revealed a maternally inherited X-linked missense mutation in MED14 (MED14V763A), a component of the mediator complex. Morpholino (MO)-mediated loss of MED14 function attenuated T cell development in zebrafish. Moreover, this arrest was rescued by ectopic expression of cDNA encoding the wild type human MED14 ortholog, but not by MED14V763A , suggesting that the variant impaired MED14 function. Modeling of the equivalent mutation in mouse (Med14V769A) did not disrupt T cell development at baseline. However, repopulation of peripheral T cells upon competitive bone marrow transplantation was compromised, consistent with the incomplete T cell reconstitution experienced by the proband upon transplantation with bone marrow from his healthy male sibling, who was found to have the same MED14V763A variant. Suspecting that the variable phenotypic expression between the siblings was influenced by further mutation(s), we sought to identify genetic variants present only in the affected proband. Indeed, WES revealed a mutation in the L1 cell adhesion molecule (L1CAMQ498H); however, introducing that mutation in vivo in mice did not disrupt T cell development. Consequently, immunodeficiency in the proband may depend upon additional, unidentified gene variants.
Keywords: MED14; T cell lymphopenia; immunodeficiency; newborn screening; severe combined immunodeficiency (SCID); thymus; zebrafish.
Copyright © 2022 Sertori, Lin, Martinez, Rana, Sharo, Kazemian, Sunderam, Andrake, Shinton, Truong, Dunbrack, Liu, Srinivasan, Brenner, Seroogy, Puck, Leonard and Wiest.
Conflict of interest statement
Authors US, RA, and RS (Srinivasan) are employed by TATA Consultancy Services. SEB was a principal investigator on a research service agreement between TCS and the University of California, Berkley. The remaining authors declare that the research was conducted in the absence of any commercial or financial relationships that could be construed as a potential conflict of interest.
Figures
Similar articles
-
Multisystem Anomalies in Severe Combined Immunodeficiency with Mutant BCL11B.N Engl J Med. 2016 Dec 1;375(22):2165-2176. doi: 10.1056/NEJMoa1509164. N Engl J Med. 2016. PMID: 27959755 Free PMC article.
-
Newborn screening for severe combined immunodeficiency and T-cell lymphopenia in California: results of the first 2 years.J Allergy Clin Immunol. 2013 Jul;132(1):140-50. doi: 10.1016/j.jaci.2013.04.024. J Allergy Clin Immunol. 2013. PMID: 23810098 Free PMC article.
-
MHC II deficient infant identified by newborn screening program for SCID.Immunol Res. 2018 Aug;66(4):537-542. doi: 10.1007/s12026-018-9019-2. Immunol Res. 2018. PMID: 30084052
-
When Screening for Severe Combined Immunodeficiency (SCID) with T Cell Receptor Excision Circles Is Not SCID: a Case-Based Review.J Clin Immunol. 2021 Feb;41(2):294-302. doi: 10.1007/s10875-020-00931-2. Epub 2021 Jan 7. J Clin Immunol. 2021. PMID: 33411155 Free PMC article. Review.
-
Newborn Screening for Severe Combined Immunodeficiency.Curr Allergy Asthma Rep. 2018 May 10;18(6):34. doi: 10.1007/s11882-018-0783-9. Curr Allergy Asthma Rep. 2018. PMID: 29749587 Review.
Cited by
-
Disruption of the moonlighting function of CTF18 in a patient with T-lymphopenia.Front Immunol. 2025 Feb 14;16:1539848. doi: 10.3389/fimmu.2025.1539848. eCollection 2025. Front Immunol. 2025. PMID: 40028343 Free PMC article.
References
-
- Puck JM. "Introduction to severe combined immunodeficiency (SCID) and combined immunodeficiency (CID). ,". In: Ochs SCH, Puck JM, 3rd, editors. Primary immunodeficiency diseases, a molecular and genetic approach. New York: Oxford University Press; (2014). p. 131–3.
Publication types
MeSH terms
Grants and funding
LinkOut - more resources
Full Text Sources
Molecular Biology Databases