Integrative lipidomic features identify plasma lipid signatures in chronic urticaria
- PMID: 35967440
- PMCID: PMC9370552
- DOI: 10.3389/fimmu.2022.933312
Integrative lipidomic features identify plasma lipid signatures in chronic urticaria
Abstract
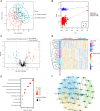
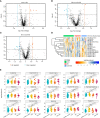
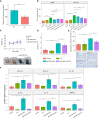
Chronic urticaria (CU) is a chronic inflammatory skin disease mainly mediated by mast cells. Lipids exert essential functions in biological processes; however, the role of lipids in CU remains unclear. Nontargeted lipidomics was performed to investigate the differential lipid profiles between CU patients and healthy control (HC) subjects. Functional validation studies were performed in vitro and in vivo including β-hexosaminidase release examination from mast cells and passive cutaneous anaphylaxis (PCA) mouse model. We detected dramatically altered glycerophospholipids in CU patients compared with HCs. Phosphatidylserine (PS), phosphatidylethanolamine (PE), and phosphatidylglycerol (PG) were increased, while phosphatidylcholine (PC) was reduced in CU patients. The reduction in PC was related to a high weekly urticaria activity score (UAS7), while PS was positively associated with the dermatology life quality index (DLQI). We also identified the differential lipid profiles between chronic spontaneous urticaria (CSU), symptomatic dermographism (SD), and CSU coexist with SD. CU patients were classified into two subtypes (subtype 1 and subtype 2) based on consensus clustering of lipid profiling. Compared with patients in subtype 2, patients in subtype 1 had elevated levels of PC (18:0e/18:2) and PE (38:2), and lower urticaria control test (UCT) scores indicated worse clinical efficiency of secondary generation H1 antihistamines treatment. Importantly, we found that supplementation with PC could attenuate IgE-induced immune responses in mast cells. In general, We described the landscape of plasma lipid alterations in CU patients and provided novel insights into the role of PC in mast cells.
Keywords: chronic urticaria; glycerophospholipid; lipidomic signatures; mast cell; phosphatidylcholine.
Copyright © 2022 Li, Li, Liu, Zhu, Zhou, Xiao, Hou, Lin, Chen and Peng.
Conflict of interest statement
The authors declare that the research was conducted in the absence of any commercial or financial relationships that could be construed as a potential conflict of interest.
Figures


Similar articles
-
An open-label, proof-of-concept study of lirentelimab for antihistamine-resistant chronic spontaneous and inducible urticaria.J Allergy Clin Immunol. 2022 May;149(5):1683-1690.e7. doi: 10.1016/j.jaci.2021.12.772. Epub 2021 Dec 23. J Allergy Clin Immunol. 2022. PMID: 34954198 Clinical Trial.
-
Clinical characteristics and management of chronic spontaneous urticaria in patients refractory to H1-Antihistamines in Asia, Middle-East and Africa: Results from the AWARE-AMAC study.World Allergy Organ J. 2020 Apr 30;13(4):100117. doi: 10.1016/j.waojou.2020.100117. eCollection 2020 Apr. World Allergy Organ J. 2020. PMID: 32382379 Free PMC article.
-
Socio-economic burden and resource utilisation in Italian patients with chronic urticaria: 2-year data from the AWARE study.World Allergy Organ J. 2020 Dec 8;13(12):100470. doi: 10.1016/j.waojou.2020.100470. eCollection 2020 Dec. World Allergy Organ J. 2020. PMID: 33343800 Free PMC article.
-
Shedding light on dermographism: a narrative review.Int J Dermatol. 2024 Aug;63(8):999-1006. doi: 10.1111/ijd.17102. Epub 2024 Feb 28. Int J Dermatol. 2024. PMID: 38419351 Review.
-
Urticaria.Nat Rev Dis Primers. 2022 Sep 15;8(1):61. doi: 10.1038/s41572-022-00389-z. Nat Rev Dis Primers. 2022. PMID: 36109590 Review.
Cited by
-
Research progress in the pathogenesis of chronic urticaria.Zhong Nan Da Xue Xue Bao Yi Xue Ban. 2023 Oct 28;48(10):1602-1610. doi: 10.11817/j.issn.1672-7347.2023.230037. Zhong Nan Da Xue Xue Bao Yi Xue Ban. 2023. PMID: 38432889 Free PMC article. Chinese, English.
-
Gut microbiota facilitate chronic spontaneous urticaria.Nat Commun. 2024 Jan 2;15(1):112. doi: 10.1038/s41467-023-44373-x. Nat Commun. 2024. PMID: 38168034 Free PMC article.
-
Gut Microbiota Mediates Skin Ulceration Syndrome Outbreak by Readjusting Lipid Metabolism in Apostichopus japonicus.Int J Mol Sci. 2022 Nov 5;23(21):13583. doi: 10.3390/ijms232113583. Int J Mol Sci. 2022. PMID: 36362371 Free PMC article.
-
Untargeted Plasma Lipidomics Reveal Perturbed Metabolites of Glycerophospholipids, and Sphingolipids in Moderate-to-Severe Acne.Clin Cosmet Investig Dermatol. 2023 Aug 11;16:2189-2200. doi: 10.2147/CCID.S426451. eCollection 2023. Clin Cosmet Investig Dermatol. 2023. PMID: 37588109 Free PMC article.
-
Lipid Metabolism Reprogramming of Immune Cells in Acne: An Update.Clin Cosmet Investig Dermatol. 2023 Sep 1;16:2391-2398. doi: 10.2147/CCID.S424478. eCollection 2023. Clin Cosmet Investig Dermatol. 2023. PMID: 37675181 Free PMC article. Review.
References
Publication types
MeSH terms
Substances
LinkOut - more resources
Full Text Sources
Medical

