. 2022 Jan 4;9(7):nwab232.
doi: 10.1093/nsr/nwab232. eCollection 2022 Jul.

Identification of TAZ as the essential molecular switch in orchestrating SCLC phenotypic transition and metastasis

Affiliations

Identification of TAZ as the essential molecular switch in orchestrating SCLC phenotypic transition and metastasis

Yujuan Jin et al. Natl Sci Rev. .

Erratum in

Abstract

Small-cell lung cancer (SCLC) is a recalcitrant cancer characterized by high metastasis. However, the exact cell type contributing to metastasis remains elusive. Using a Rb1 L/L /Trp53 L/L mouse model, we identify the NCAMhiCD44lo/- subpopulation as the SCLC metastasizing cell (SMC), which is progressively transitioned from the non-metastasizing NCAMloCD44hi cell (non-SMC). Integrative chromatin accessibility and gene expression profiling studies reveal the important role of the SWI/SNF complex, and knockout of its central component, Brg1, significantly inhibits such phenotypic transition and metastasis. Mechanistically, TAZ is silenced by the SWI/SNF complex during SCLC malignant progression, and its knockdown promotes SMC transition and metastasis. Importantly, ectopic TAZ expression reversely drives SMC-to-non-SMC transition and alleviates metastasis. Single-cell RNA-sequencing analyses identify SMC as the dominant subpopulation in human SCLC metastasis, and immunostaining data show a positive correlation between TAZ and patient prognosis. These data uncover high SCLC plasticity and identify TAZ as the key molecular switch in orchestrating SCLC phenotypic transition and metastasis.

Keywords: SWI/SNF complex; TAZ; metastasis; phenotypic transition; small cell lung cancer.


Figures

Figure 1.
Figure 1.
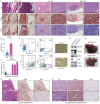
Identification of the NCAMhiCD44lo/– cells as SCLC metastasizing cells in the RP mouse model. (A) Representative photos of Hematoxylin-Eosin (HE) staining, NCAM and CD44 IHC staining of primary tumors, liver and kidney metastases (met) from the RP mouse model. The intra-tumor heterogeneity of primary tumors is shown in high magnification. The marked areas in high magnification panels indicate the NCAMhiCD44lo/– expression pattern. Scale bars, 100 μm. (B) Statistic analyses of the NCAMhiCD44lo/– tumors at limited stage (no overt distant organ metastasis) and extensive stage (overt metastasis) in the RP model. The NCAMhiCD44lo/– tumors were defined when the lesions contained >50% of cells showing NCAMhi and CD44lo/– expression. Limited stage: 87 tumors from 4 mice were analyzed; extensive stage: 98 tumors from 4 mice were analyzed. Data are shown as mean ± S.E.M. P value was calculated by unpaired two-tailed t test. (C) Flow cytometry (FACS) analyses of primary tumors from the RP mouse model using antibodies towards EpCAM, NCAM and CD44. The tumor cells without primary antibody incubation are shown as negative control (top panels). The NCAMloCD44hi and NCAMhiCD44lo/– cells were sorted and cultured in vitro and the representative cell growth photos are shown on the right. Scale bar, 100 μm. (D) Western blot detection of EpCAM, NCAM, CD44, ASCL1 and TAZ expression in established NCAMloCD44hi and NCAMhiCD44lo/– SCLC primary cell lines. (E and F) Representative photos (E) and the incidence (F) of liver metastasis in nude mice subcutaneously transplanted with primary NCAMloCD44hi or NCAMhiCD44lo/– cells derived from the RP mouse model. Data are shown from three independent experiments (n = 5 mice for each experiment). The ratio of mice with liver metastasis was also indicated. P value was calculated by unpaired two-tailed t test. (G and H) Representative photos of HE staining, NCAM and CD44 IHC staining of (G) liver metastases, and (H) subcutaneous tumors in nude mice transplanted with NCAMhiCD44lo/– cell lines. Scale bars, 100 μm.
Figure 2.
Figure 2.
Phenotypic transition from non-SMC to SMC contributes to SCLC metastasis. (A) Representative photos for HE staining, NCAM and CD44 IHC staining in the only liver metastasis from nude mice subcutaneously transplanted with the NCAMloCD44hi cell lines (non-SMC) derived from the RP mouse model. Scale bars, 100 μm. (B) Experimental scheme to test phenotypic transition from non-SMC to SMC. Primary non-SMC was derived from the RP mouse model and ectopically expressed GFP, and then used for subcutaneous transplantation in nude mice. The subcutaneous tumors were analyzed through oncosphere formation, and NCAM and CD44 IF staining. Oncospheres in cell culture were indicated. (C) Representative photos of NCAM and CD44 IF staining in subcutaneous tumors from nude mice transplanted with non-SMC-GFP cells. The NCAMhiCD44lo/– subpopulation indicated by white arrows were microscopically counted and the mean ratio of NCAMhiCD44lo/– cells is indicated in the top right corner. Scale bar, 25 μm. Data are shown as mean ± S.E.M. (D) Experimental scheme to test the potential phenotypic transition using single-cell-derived clonal non-SMC-GFP. The subcutaneous tumors were then analyzed through oncosphere formation and NCAM and CD44 IF staining. Oncospheres in cell culture were indicated. (E) Representative photos of NCAM and CD44 IF staining in clonal non-SMC-GFP subcutaneous tumors. C1: clone #1; C2: clone #2. The NCAMhiCD44lo/– subpopulation indicated by white arrows was microscopically counted and the ratio of NCAMhiCD44lo/– cells is indicated in the top right corner. Scale bar, 25 μm. Data are shown as mean ± S.E.M. (F) Statistical analyses of the incidence of lymph node (LN), lung and liver metastases in nude mice subcutaneously transplanted with transitioned SMC or non-SMC, which were derived from the clonal non-SMC-GFP subcutaneous tumors. n = 4 mice for transitioned SMC group and n = 5 mice for paired non-SMC group. P values were calculated by Pearson chi-square test. (G) Representative photos of NCAM and CD44 IHC staining of mouse livers in (F). The livers from paired non-SMC showed no metastasis. Scale bar, 100 μm.
Figure 3.
Figure 3.
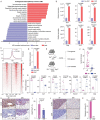
Knockout of Brg1 in the RP mouse model significantly abrogates SMC phenotypic transition and SCLC metastasis. (A) The enrichment of small-cell neuroendocrine (SCN) signature-related pathways in SMC and the enrichment of immune-related pathways in non-SMC. NES, normalized enrichment score. (B) Real-time PCR detection of SCN-signature-related genes including Ascl1, Insm1, Neurod1, Chga, Sox11 and Ttf1 in SMC vs. non-SMC. Data are shown as mean ± S.E.M. P values were calculated by unpaired two-tailed t test. (C) Trend plot (top) and heat map (bottom) showing ATAC-seq signal over 6 kb regions centered at the transcription start sites (TSS) in SMC and non-SMC. (D) Real-time PCR detection of Brg1 expression in SMC vs. non-SMC. (E) Schematic illustration of the comparative analyses of Rb1L/L/Trp53L/L (RP) and Rb1L/L/Trp53L/L/Brg1L/L (RPB) mice. (F) Statistical analyses of primary tumor numbers in RP and RPB mice at 32 weeks after Ad-Cre treatment. n = 18 mice for the RP group, n = 10 mice for the RPB group. Data are shown as mean ± S.E.M. P value was calculated by unpaired two-tailed t test. (G) Real-time PCR detection of Brg1 and the SCN-signature-related genes in primary tumors from RP and RPB mice. n = 2 mice for each group. Data are shown as mean ± S.E.M. P values were calculated by unpaired two-tailed t test. (H) Representative photos of NCAM and CD44 IHC staining in primary tumors from RP and RPB mice at 32 weeks after Ad-Cre treatment. Scale bar, 100 μm. (I) Statistical analyses of the percentage of primary tumors with an NCAMhiCD44lo/– expression pattern in RP and RPB mice. The NCAMhiCD44lo/– tumors were defined when the lesions contained >50% of cells showing NCAMhi and CD44lo/– expression. A total of 56 tumors from 3 RP mice and 28 tumors from 4 RPB mice were analyzed. Data are shown as mean ± S.E.M. P value was calculated by unpaired two-tailed t test. (J) Representative photos of NCAM and CD44 IHC staining in livers of RP and RPB mice. The livers from RPB mice contained no metastasis. Scale bar, 100 μm. (K) Liver metastasis incidence in RP and RPB mice at 32 weeks after Ad-Cre treatment. n = 18 mice for the RP group, n = 10 mice for the RPB group. P value was calculated by Pearson chi-square test.
Figure 4.
Figure 4.
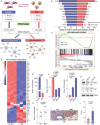
TAZ is epigenetically silenced by the SWI/SNF complex in SMC. (A) Schematic illustration of the integrative analyses of RNA-seq and ATAC-seq in SMC and non-SMC. Specific TF networks in SMC and non-SMC were constructed according to the PECA2 model (see details in Materials and Methods). TG, target genes. (B) Enriched TFs in SMC and non-SMC through integrative analyses of ATAC-seq and RNA-seq data ranked according to the numbers of dysregulated target genes. (C) Gene set enrichment analysis (GSEA) plot of the Hippo signaling pathway in SMC vs. non-SMC. (D) Heat map of RNA-seq data showing the relative expression of TFs and cofactors in the Hippo pathway in SMC vs. non-SMC. (E) Real-time PCR detection of Taz in SMC and non-SMC. Data are shown as mean ± S.E.M. P value was calculated by unpaired two-tailed t test. (F) Real-time PCR detection of Brg1 and Taz in SMC with or without Brg1 knockdown. Gapdh served as the internal control. Data are shown as mean ± S.E.M. P values were calculated by unpaired two-tailed t test. (G) Western blot detection of BRG1 and TAZ levels in SMC with or without Brg1 knockdown. GAPDH served as the internal control. (H) Real-time PCR detection of Taz in primary tumors from RP and RPB mice at 32 weeks after Ad-Cre treatment. Gapdh served as the internal control. n = 2 for each group. Data are shown as mean ± S.E.M. P value was calculated by unpaired two-tailed t test. (I) Representative photos of TAZ IHC staining in primary tumors from RP and RPB mice at 32 weeks after Ad-Cre treatment. Scale bar, 100 μm. (J) Percentage of TAZ positive tumors in RP vs. RPB mice at 32 weeks after Ad-Cre treatment; 56 tumors from 3 RP mice and 28 tumors from 4 RPB mice were analyzed. Data are shown as mean ± S.E.M. P value was calculated by unpaired two-tailed t test.
Figure 5.
Figure 5.
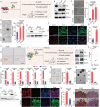
TAZ functions as a critical molecular switch in regulating the phenotypic transition and SCLC metastasis. (A) Schematic illustration of the comparative analyses of non-SMC with or without Taz knockdown. (B) Western blot detection of TAZ, NCAM and CD44 levels in non-SMC with or without Taz knockdown. GAPDH served as the internal control. (C) Representative photos of the matrigel invasiveness of non-SMC with or without Taz knockdown (left). The statistical analyses of the clone sizes were performed using Image J software. Scale bars, 100 μm. P values were calculated by unpaired two-tailed t test. (D) Representative photos (left) and number (right) of the soft-agar colonies of non-SMC with or without Taz knockdown. Scale bars, 100 μm. Data are shown as mean ± S.E.M. P value was calculated by unpaired two-tailed t test. (E) Western blot detection of cleaved caspase3 (CC3) in anti-anoikis assay of non-SMC with or without Taz knockdown. TUBULIN served as the internal control. (F) Representative photos of NCAM and CD44 IF staining in subcutaneous tumors from nude mice transplanted with non-SMC with or without Taz knockdown. Scale bar, 25 μm. (G) Metastasis incidence and (H) representative photos of NCAM and CD44 IHC staining in livers from nude mice transplanted by non-SMC with or without Taz knockdown. n = 6 for each group. P value was calculated by Pearson chi-square test. Scale bar, 100 μm. (I) Schematic illustration of the comparative analyses of SMC with or without ectopic TAZ-4SA expression. (J) Western blot detection of TAZ, NCAM and CD44 levels in SMC with or without ectopic TAZ-4SA expression. GAPDH served as the internal control. (K) SCN score of SMC with or without ectopic TAZ-4SA expression. Data are shown as mean ± S.E.M. P value was calculated by unpaired two-tailed t test. (L) Real-time PCR detection of the SCN-signature-related genes in SMC with or without ectopic TAZ-4SA expression. Gapdh served as the internal control. Data are shown as mean ± S.E.M. P values were calculated by unpaired two-tailed t test. (M) Representative photos of the matrigel invasiveness of SMC with or without ectopic TAZ-4SA expression (left). The statistical analyses of the clone sizes were performed using Image J software. Scale bar, 100 μm. P values were calculated by unpaired two-tailed t test. (N) Representative photos (left) and statistical analyses (right) of soft-agar colonies of SMC with or without ectopic TAZ-4SA expression. Scale bar, 100 μm. Data are shown as mean ± S.E.M. P value was calculated by unpaired two-tailed t test. (O) Western blot detection of CC3 in an anti-anoikis assay of SMC with or without ectopic TAZ-4SA expression. TUBULIN served as the internal control. (P) Representative photos of NCAM and CD44 IF staining in subcutaneous tumors from nude mice transplanted with SMC with or without ectopic TAZ-4SA expression. Scale bar, 25 μm. (Q) Metastasis incidence (left) and representative photos of NCAM and CD44 IHC staining of liver metastasis (right) in nude mice transplanted with SMC with or without ectopic TAZ-4SA expression. n = 6 mice for the control group, n = 7 mice for the TAZ-4SA group. Scale bar, 100 μm. P value was calculated by Pearson chi-square test.
Figure 6.
Figure 6.
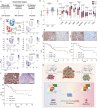
Low TAZ level is correlated with SCN signature enrichment and predicts poor prognosis of SCLC patients. (A) Schematic illustration of the analyses of human SCLC specimens. (B) SCN score of human SCLC specimens with high or low TAZ mRNA level. The RNA-seq data were downloaded from a public database (GSE69091 and EGAS00001000334). Data are shown as mean ± S.E.M. P value was calculated by unpaired two-tailed t test. (C) Correlation between individual SCN-signature-related genes, CD44 or TEAD2 expression with high or low TAZ level in human SCLC (GSE69091 and EGAS00001000334). Data are shown as mean ± S.E.M. P values were calculated by unpaired two-tailed t test. (D) Clustering and the NCAM, CD44, TAZ, NEUROD1 and INSM1 expression of the single cell sequencing data (GSM4558305) of a liver biopsy from an SCLC patient. (E and F) Representative photos of (E) NCAM, CD44 and (F) TAZ IHC staining in Chinese SCLC specimens (top) and survival curves of high or low expression of NCAM, CD44 or TAZ with overall survival (OS) (bottom). Scale bar, 100 μm. P values were calculated by Kaplan-Meier analysis with log-rank test. (G) Working model illustrating the essential role of SWI/SNF-complex-mediated TAZ expression in controlling the phenotypic transition from non-SMC to SMC and SCLC metastasis. TAZ, which is epigenetically silenced by the SWI/SNF complex, functions as a critical molecular switch during the phenotypic transition from non-SMC to SMC and SCLC metastasis. Disruption of the SWI/SNF complex through BRG1 knockout promotes TAZ upregulation and thus inhibits the phenotypic transition and cancer metastasis.

Similar articles

Cited by

References

    1. Gazdar AF, Bunn PA, Minna JD. Small-cell lung cancer: what we know, what we need to know and the path forward. Nat Rev Cancer 2017; 17: 725–37.10.1038/nrc.2017.87 - DOI - PubMed
    1. George J, Lim JS, Jang SJet al. . Comprehensive genomic profiles of small cell lung cancer. Nature 2015; 524: 47–53.10.1038/nature14664 - DOI - PMC - PubMed
    1. Meuwissen R, Linn SC, Linnoila RIet al. . Induction of small cell lung cancer by somatic inactivation of both Trp53 and Rb1 in a conditional mouse model. Cancer Cell 2003; 4: 181–9.10.1016/S1535-6108(03)00220-4 - DOI - PubMed
    1. Schaffer BE, Park KS, Yiu Get al. . Loss of p130 accelerates tumor development in a mouse model for human small-cell lung carcinoma. Cancer Res 2010; 70: 3877–83.10.1158/0008-5472.CAN-09-4228 - DOI - PMC - PubMed
    1. McFadden DG, Papagiannakopoulos T, Taylor-Weiner Aet al. . Genetic and clonal dissection of murine small cell lung carcinoma progression by genome sequencing. Cell 2014; 156: 1298–311.10.1016/j.cell.2014.02.031 - DOI - PMC - PubMed