Case Reports
. 2022 Aug 2:2022:2747108.
doi: 10.1155/2022/2747108. eCollection 2022.

The Role of Targeted Osmotic Lysis in the Treatment of Advanced Carcinoma in Companion Animals: A Case Series

Affiliations
Case Reports

The Role of Targeted Osmotic Lysis in the Treatment of Advanced Carcinoma in Companion Animals: A Case Series

Harry J Gould 3rd et al. Case Rep Vet Med. .

Abstract

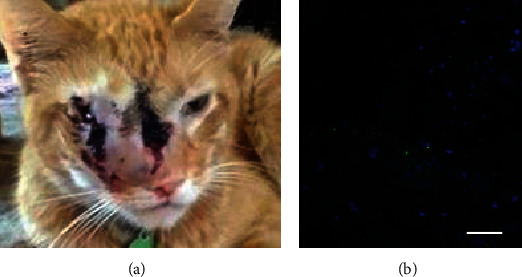
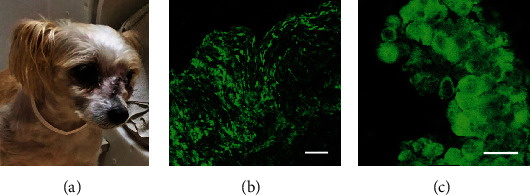
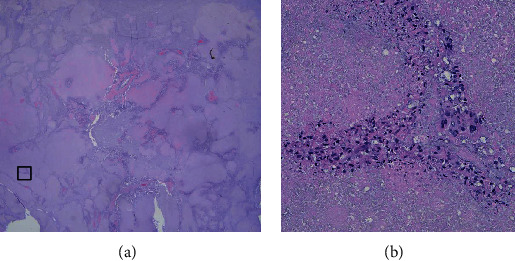
Background: Targeted osmotic lysis (TOL) is a novel technology that involves concomitant stimulation of voltage-gated sodium channels (VGSCs) and the pharmacological blockade of Na+, K+-ATPase causing lysis of highly malignant cancer cells. Hypothesis/Objectives. TOL offers an option for treating advanced carcinomas in companion animals. Animals. Two cats and 2 dogs that presented to veterinary hospitals for evaluation and treatment of one of several forms of carcinoma.

Methods: Digoxin was administered to achieve steady-state, therapeutic concentrations. The animals were then exposed to pulsed electric field stimulation. Pre- and posttreatment assessments of tumor size and quality of life were compared. The treatment frequency and survivability varied, based on the patient's premorbid functioning and response to treatment.

Results: Regardless of cancer type, TOL consistently increased survival beyond expected, often improving, but without compromising of quality of life. Conclusions and Clinical Importance. TOL warrants consideration as an option for managing advanced carcinomas.


Conflict of interest statement

H.J.G., P.R.M, and D.P. are cofounders and managing members of Oleander Medical Technologies, L.LC.

Figures

Figure 1
Figure 1
The photograph in (a) depicts the toroidal device used to deliver the uniform PEFs with to open VGSCs; maximum field amplitude of 6 V/m. The photograph in (b) depicts the coaxial ring device used to deliver PEFs with a field amplitude of 18 V/m. (c) Dogs in the carriers that allowed room for ad libitum movement to adjust position for comfort during the period of stimulation while being treated with TOL.
Figure 2
Figure 2
The photograph in (a) depicts the appearance of a large mass that involved the right orbit and at the time of presentation had erupted through the skin as an open wound over the bridge of the nose and face. The photomicrograph in (b) depicts the prominent immunohistofluorescent labeling of VGSCs (green) observed in a tissue sample taken from the tumor in (a) before treatment with TOL. For comparison, the photomicrograph in (c) depicts a similarly processed tissue sample showing VGSC expression in a murine homograft that was assessed in a pre-clinical study to determine the efficacy of TOL in treating triple-negative breast cancer. The calibration bar for photomicrographs in B = 25 μm and nuclei (blue) are labeled with DRAQ5.
Figure 3
Figure 3
The CT images depict soft tissue (b, d) and bone window (a, c) images of the rostral (a, b) and caudal (c, d) portions of the tumor shown in Figure 1 prior to treatment with TOL. Note that the tumor involves and extends beyond the margins of the right orbit, invades the paranasal sinuses bilaterally, and perforates the hard palate extending into the oral pharynx.
Figure 4
Figure 4
The CT images depict soft tissue and bone window images of closely comparable rostral (a-f) and caudal (g-l) portions of the tumor shown before (a, b, g, h) and after (c, d, i, j, e, f, k l) each of 2 rounds of treatment with TOL. Despite the improvement in the patient's level of social interaction and appetite, there was no evidence to support a reduction in the tumor mass.
Figure 5
Figure 5
The photograph in (a) depicts the appearance of the mass presented Figure 1 after 2 rounds of treatment with TOL. Note the reduction in localized edema revealing more of the globe of the eye. The photomicrograph in (b), compared to the photomicrograph in Figure 1(b), depicts the relative absence of cells that highly express VGSCs (green) following treatment with TOL. The calibration bar = 25 μm.
Figure 6
Figure 6
The CT images depict soft tissue (b, d) and bone window (a, c) images of the rostral (a, b) and caudal (c, d) portions of a large facial carcinoma that involved the right orbital wall and nasal turbinate bones and had extended into the paranasal sinuses.
Figure 7
Figure 7
The photograph in (a) depicts the appearance of a large mass that involved the right orbit and at the time of presentation had erupted through the skin over the bridge of the nose and face. The low-power (b) and high-power (c) photomicrographs depict the prominent immunohistofluorescent labeling of VGSCs (green) revealed in a tissue sample taken from the tumor in (a) before treatment with TOL. The calibration bar for photomicrographs in (b) and (c) is 50 and 25 μm, respectively.
Figure 8
Figure 8
The photograph in (a) depicts the appearance of the mass presented in Figure 7 after debulking, cauterization and 4 rounds of treatment with TOL. The photomicrograph in (b), compared to the photomicrograph in Figure 7(b) and Figure 7(c), depicts the significant reduction in the number of cells that highly express VGSCs (green) following treatment with TOL. The calibration bar in (c) is 25 μm.
Figure 9
Figure 9
The soft tissue (b, d) and bone window (a, c) CT images obtained approximately 6 months after the images presented in Figure 6 approximate the levels shown in Figure 6. Despite palliative debulking procedures and 6 months of chemotherapy, no appreciable changes were noted in the deep-seated portions of the tumor.
Figure 10
Figure 10
The chest X-rays in (a) and (b) depict the AP and RL appearance of 2 masses in the right lung prior to treatment with TOL. The larger mass (black arrows) is located centrally in the middle lobe in close proximity to the hilus of the lung and smaller mass (white arrows) is located more caudal in the cranial lobe. (c, d) The appearance of the same masses 7 months later after receiving 7 rounds of treatment with TOL. Taking account of the positioning in the X-ray machine, the size of the tumors varied but appeared to have increased gradually by approximately 28% over the 7 1/2 month course of treatment. The calibration bar in (d) is 2.5 μm.
Figure 11
Figure 11
The photomicrograph in (a) depicts the immunohistofluorescent labeling of VGSCs (green) observed in a tissue sample taken from the larger tumor mass before treatment with TOL. The immunohistofluorescent evaluation of a tissue sample obtained after treatment with TOL in B reveals the significant reduction in the number of cells that highly express VGSCs. The calibration bar in (b) is 25 μm.
Figure 12
Figure 12
The photomicrograph in (a) is a low-power (X1) image of a representative portion of the lung tumor that had received 8 rounds of treatment with TOL alone over 7 1/2 months. The tissue was taken at the time of necropsy and stained with hematoxylin and eosin. Note the large areas of necrosis that comprise over 90% of the tumor mass. The photomicrograph in (b) is a X40 enlargement of the tissue field defined by the box in (a) that illustrates in greater detail the few blood vessels and neoplastic cells that remained.
Figure 13
Figure 13
The photographs in (a) depicts the appearance of a large tumor located in the left oral pharynx (large arrow) and a second, smaller mass on the right (small arrow) that was discovered on initial physical examination (a). The photograph in (b) depicts the tumors midway through a third treatment with TOL. Note that the smaller tumor is no longer apparent (small arrow) and the larger tumor is significantly reduced. The calibration bar in (a) is 3 mm. The photomicrograph in (c) depicts the immunohistofluorescent labeling of VGSCs observed in a tissue sample taken from the tumor in (a) before treatment with TOL. Note that TOL was the only treatment provided in the management of the tumors. The calibration bar in (c) is 25 μm.

Similar articles

Cited by

References

    1. Fetch a Cure. Facts. 2021, https://fetchacure.org/resource-library/facts/
    1. Gould H. J., 3rd, Norleans J., Ward T. D., Reid C., Paul D. Selective lysis of breast carcinomas by simultaneous stimulation of sodium channels and blockade of sodium pumps. Oncotarget . 2018;9(21):15606–15615. doi: 10.18632/oncotarget.24581. - DOI - PMC - PubMed
    1. Paul D., Maggi P., Piero F. D., et al. Targeted osmotic lysis of highly invasive breast carcinomas using pulsed magnetic field stimulation of voltage-gated sodium channels and pharmacological blockade of sodium pumps. Cancers . 2020;12(6):1420–1433. doi: 10.3390/cancers12061420. - DOI - PMC - PubMed
    1. Onkal R., Djamgoz M. B. Molecular pharmacology of voltage-gated sodium channel expression in metastatic disease: clinical potential of neonatal NaV1.5 in breast cancer. European Journal of Pharmacology . 2009;625(1-3):206–219. doi: 10.1016/j.ejphar.2009.08.040. - DOI - PubMed
    1. Djamgoz M. B., Onkal R. Persistent current blockers of voltage-gated sodium channels: a clinical opportunity for controlling metastatic disease. Recent Patents on Anti-Cancer Drug Discovery . 2013;8(1):66–84. - PubMed

Publication types

LinkOut - more resources