. 2022 Jul 26:9:898655.
doi: 10.3389/fnut.2022.898655. eCollection 2022.

Early Life to Adult Brain Lipidome Dynamic: A Temporospatial Study Investigating Dietary Polar Lipid Supplementation Efficacy

Affiliations

Early Life to Adult Brain Lipidome Dynamic: A Temporospatial Study Investigating Dietary Polar Lipid Supplementation Efficacy

Manuel Oliveira et al. Front Nutr. .

Abstract

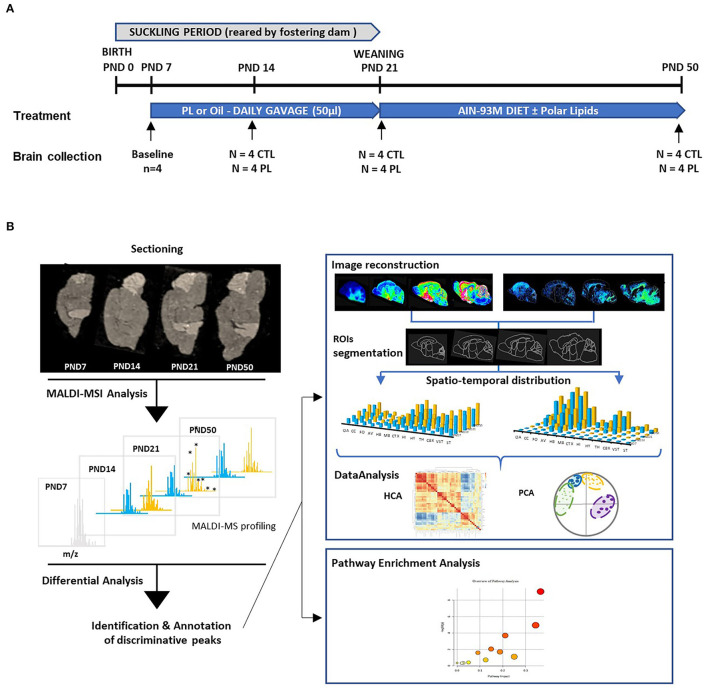
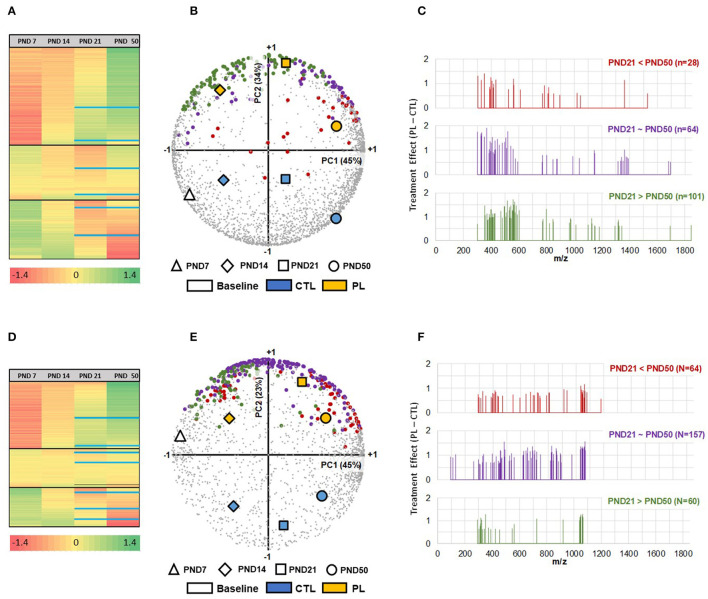
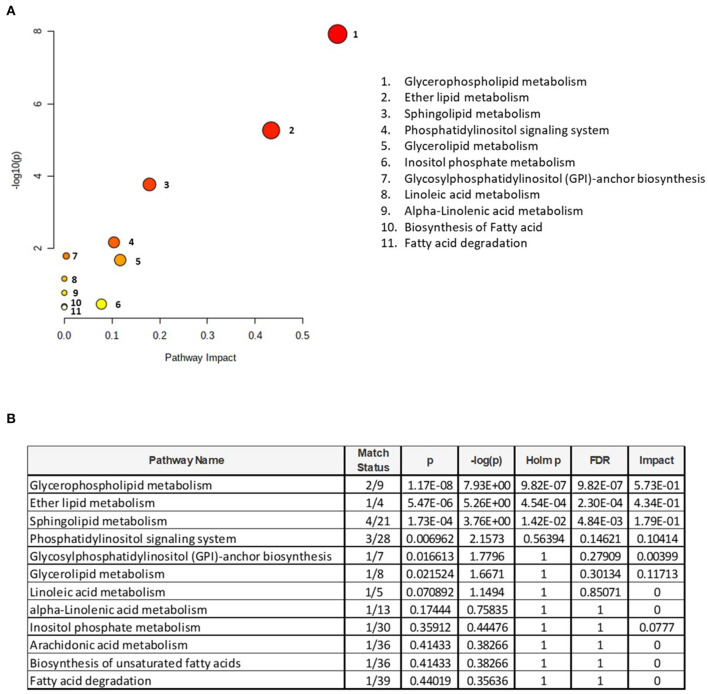
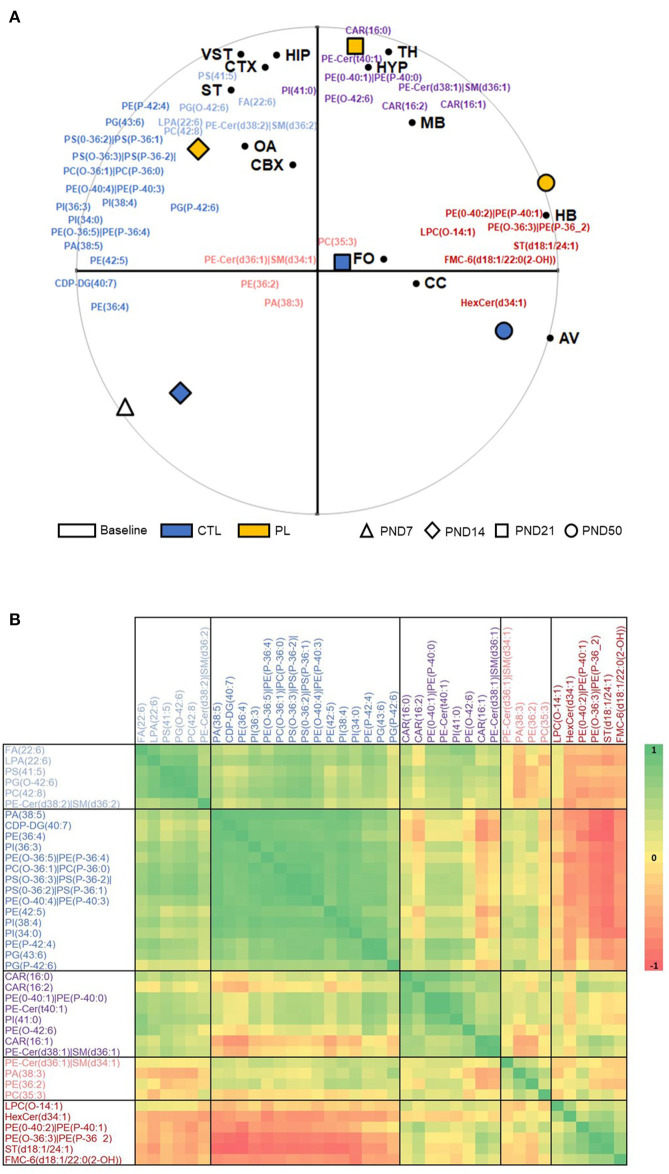
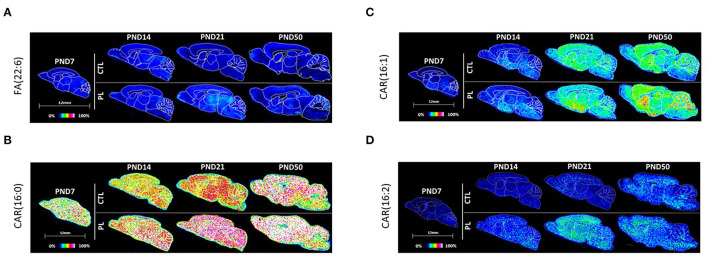
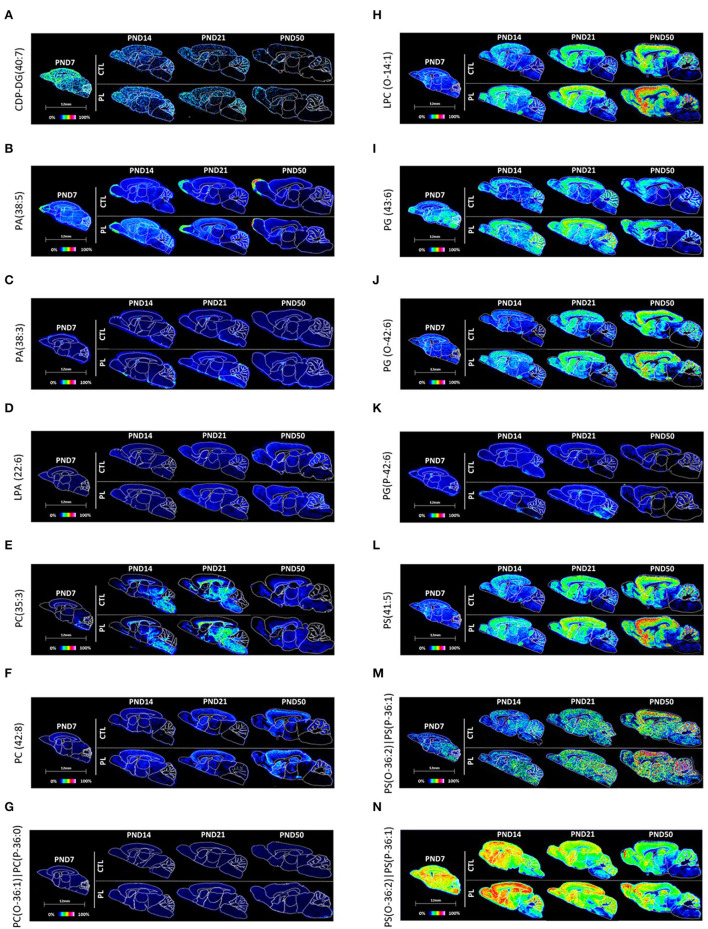
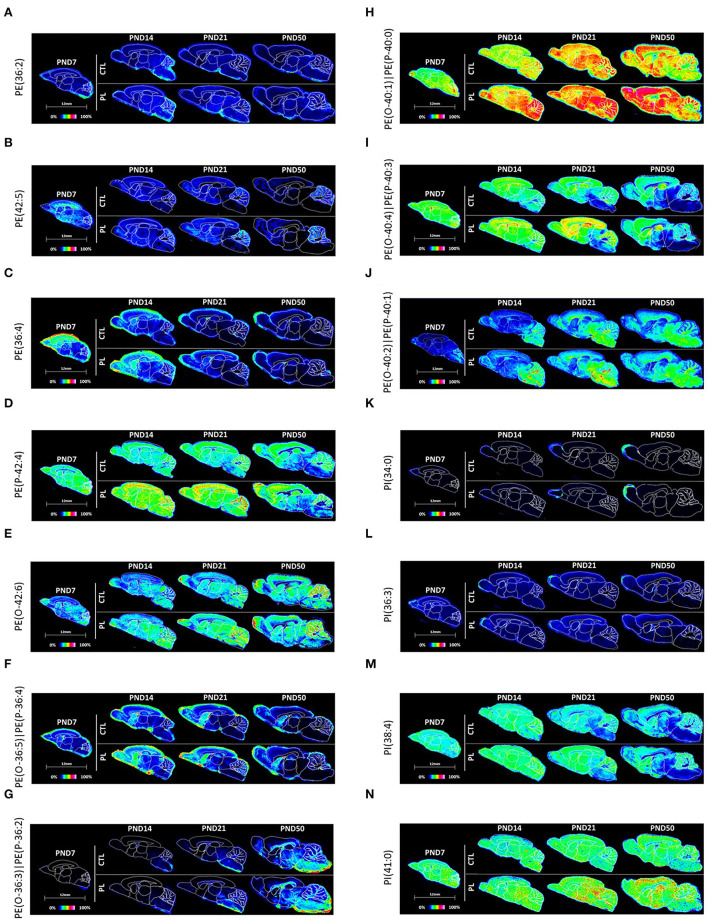
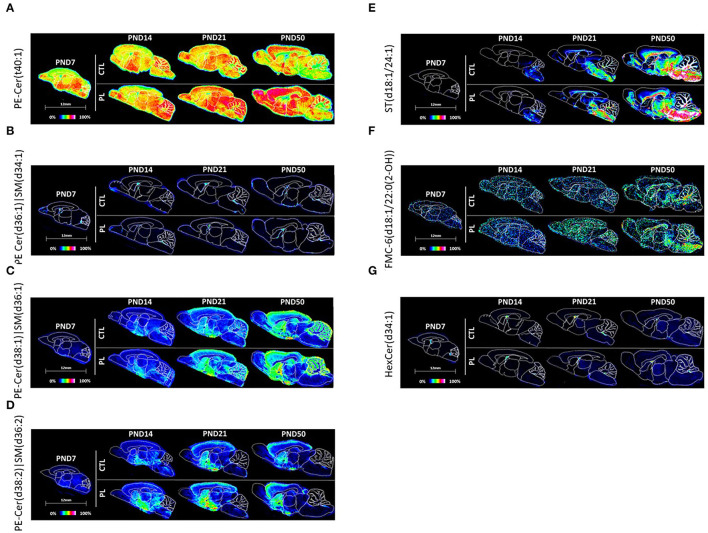
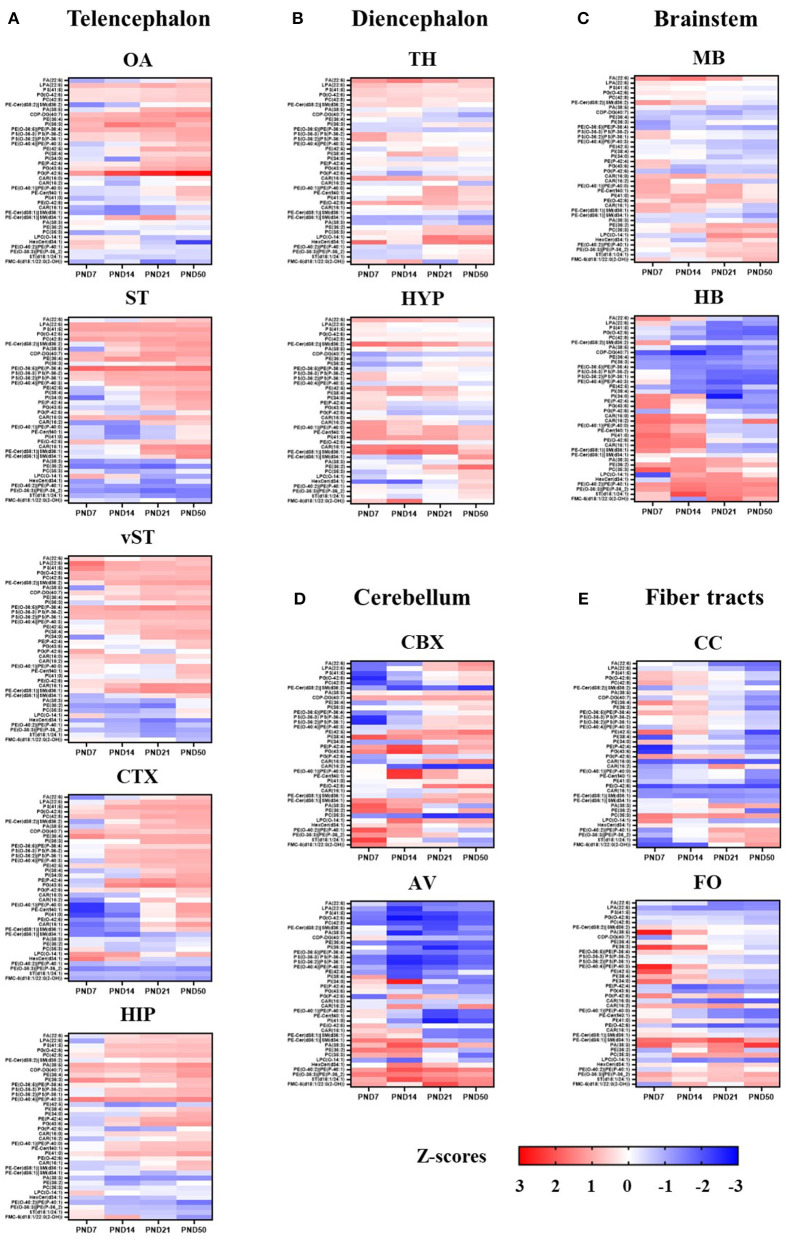
The lipid composition of the brain is well regulated during development, and the specific temporospatial distribution of various lipid species is essential for the development of optimal neural functions. Dietary lipids are the main source of brain lipids and thus contribute to the brain lipidome. Human milk is the only source of a dietary lipids for exclusively breastfed infant. Notably, it contains milk fat globule membrane (MFGM) enriched in polar lipids (PL). While early life is a key for early brain development, the interplay between dietary intake of polar lipids and spatial dynamics of lipid distribution during brain development is poorly understood. Here, we carried out an exploratory study to assess the early postnatal temporal profiling of brain lipidome between postnatal day (PND) 7 and PND 50 using matrix-assisted laser desorption ionization as a mass spectrometry imaging (MALDI-MSI) in an in vivo preclinical model. We also assessed the effect of chronic supplementation with PL extracted from alpha-lactalbumin-enriched whey protein concentrate (WPC) containing 10% lipids, including major lipid classes found in the brain (37% phospholipids and 15% sphingomyelin). MALDI-MSI of the spatial and temporal accretion of lipid species during brain development showed that the brain lipidome is changing heterogeneously along time during brain development. In addition, increases in 400+ PL supplement-dependent lipids were observed. PL supplementation had significant spatial and temporal effect on specific fatty esters, glycerophosphocholines, glycerophosphoethanolamines, and phosphosphingolipids. Interestingly, the average levels of these lipids per brain area tended to be constant in various brain structures across the age groups, paralleling the general brain growth. In contrast, other lipids, such as cytidine diphosphate diacylglycerol, diacylglycerophosphates, phosphocholines, specific ether-phosphoethanolamines, phosphosphingolipids, glycerophosphoinositols, and glycerophosphoserines showed clear age-dependent changes uncoupled from the general brain growth. These results suggest that the dietary PL supplementation may preferentially provide the building blocks for the general brain growth during development. Our findings add to the understanding of brain-nutrient relations, their temporospatial dynamics, and potential impact on neurodevelopment.

Keywords: MALDI-MSI; brain development; phospholipids; polar lipids; sphingolipids.


Conflict of interest statement

MO, KK, AR, FG, AP, SS, PS, and NS were employed by the company Société des Produits Nestlé SA. MG and AT were employed by ImaBiotech SAS.

Figures

Figure 1
Figure 1
Experimental design. (A) The experimental paradigm and the number of animals terminated at each time point are shown. At birth, 8 male rat pups were randomly allocated into 4 different litters reared by lactating dams. At PND 7, pups within each litter were randomly assigned to control (CTL) and polar lipids (PL) (n = 4 per group). Nutritional supplementation started at PND 7 and lasted until the animals were terminated at respective time points. About 1 Litter, consisting of 4 control and 4 PL animals, was terminated at PND 7, 14, 21 and 50, and the brains were collected. (B) A schematic overview of the MALDI-MSI analysis is described. In brief, 10-μm-thick sagittal sections of brains from different time points were mounted on conductive MALDI slides. A full scan MALDI-MSI spectra was collected in positive and negative ionization mode. Discriminative peaks were identified by differential analysis between the two groups. Pathway enrichment analysis was performed using annotated molecular species. To obtain their spatiotemporal distribution, reconstituted molecular images were segmented in ROIs based on histological staining performed in juxtaposed section. Multivariate analysis was performed to identify pattern similarities among different annotated species.
Figure 2
Figure 2
Neurodevelopmental changes in brain lipidome and the impact of the PL supplementation. (A,D) In total, three developmental clusters (increasing, no change, and decreasing with age) of brain lipidome were detected using HCA, shown for positive and negative ionization mode, respectively. The black solid lines divide the three clusters within the HCA heatmap. Within each cluster, 3 additional subclusters were identified, divided by blue solid lines within each cluster, for PND 21 and PND 50. PCA Biplot of first and second principal components with Treatment x Age positioned for m/z detected in (B) positive ionization mode (n = 3,108) and (E) negative ionization mode (n = 2,133). PC1 (plotted on x-axis), accounting for 45% in both modes, is highly associated with developmental age, whereas PC2 (plotted on y-axis), accounting for 34% in positive and 23% in negative modes, respectively, is strongly differentiating the two treatments, revealing that more than 70% of total variability is explained by the independent contributions of age and treatment effects. Selected m/z are further colored accordingly to their evolution pattern between PND 21 and PND 50 (C,F). The m/z identified by differential analysis at PND 21 in positive and negative ionization modes were subcategorized into molecular species that increased (red), decreased (green) and stayed the same (purple) at PND 50 compared to PND 21. The selected hits 193 (+) and 281 (-), are shown as a function of m/z. The x-axis corresponds to the mass range, whereas the y-axis shows the peak intensity difference between experimental groups expressed in log. All analysis were performed on z-scores of log-transformed peak intensities.
Figure 3
Figure 3
Pathway enrichment analysis. (A) Identification of metabolomic pathways altered by the supplementation and (B) metabolome view with all matched pathways according to the p-values from the pathway enrichment analysis and pathway impact values from the pathway topology analysis are presented. The size of the circle reflects the impact on the pathway, where larger circles denote bigger impacts. The color intensities increase with reducing p-value. Match status is the total number of annotated lipids in the pathway. The raw p is the original p-values calculated from the enrichment analysis. The holm p is the value adjusted by Holm–Bonferroni method. The impact is the pathway impact value calculated from the pathway topology analysis.
Figure 4
Figure 4
Time-coordinated spatial distribution of annotated lipids. (A) Biplot of first and second principal components with Treatment x Age positioned relative to all annotated species are shown. PC1, accounting for 40%, is highly associated with developmental age, whereas PC2, accounting for 26%, is strongly differentiating the two treatments, revealing a similar pattern for these 39 annotated species compared to all 5241 m/z detected in the two ionization modes. The average positions of ROIs are further superimposed on this biplot. (B) Pearson correlation heatmap of all annotated species based on Treatment x Age x ROI z-scores on log-transformed data is shown. A total of five clusters were identified using the furthest neighbor aggregation hierarchical clustering. OA, olfactory area; CTX, cortex; ST, striatum; vST, ventral striatum; TH, thalamus; HYP, hypothalamus; MB, midbrain; HB, hindbrain; CBX, cerebellum; AV, arbor vitae; CC, corpus callosum; FO, fornix.
Figure 5
Figure 5
Spatiotemporal distribution of fatty esters. Representative MALDI-MSI images are shown for (A) fatty acid FA(22:6) and (B–D) acylcarnitines CAR(16:0), CAR(16:1), and CAR(16:2). Control sections are presented on the top. PL-supplemented sections are presented on the bottom. The age is indicated above the images. The signal intensity scale is normalized to 100% of maximum peak intensity across all images.
Figure 6
Figure 6
Spatiotemporal distribution of glycerophospholipids. Representative MALDI-MSI images are shown for (A) CDP-DG, (B–D) glycerophosphates, (E–H) glycerophosphocholines, (I–K) glycerophosphoglycerols, and (L–N) glycerophosphoserines. Control sections are presented on the top. PL-supplemented sections are presented on the bottom. The age is indicated above the images. The signal intensity scale is normalized to 100% of maximum peak intensity across all images.
Figure 7
Figure 7
Spatiotemporal distribution of glycerophospholipids. Representative MALDI-MSI images are shown for (A–J) phosphoethanolamines and (K–N) phosphoinositol. Control sections are presented on the top. PL-supplemented sections are presented on the bottom. The age is indicated above the images. The signal intensity scale is normalized to 100% of maximum peak intensity across all images.
Figure 8
Figure 8
Spatiotemporal distribution of sphingolipids. Representative MALDI-MSI images are shown for (A–D) phosphosphingolipids, (E) acidic and (F,G) neutral glycosphingolipids. Control sections are presented on the top. PL-supplemented sections are presented on the bottom. The age is indicated above the images. The signal intensity scale is normalized to 100% of maximum peak intensity across all images.
Figure 9
Figure 9
Summary of developmental profile of 39 lipids in each ROI. Developmental profile of 39 lipids in each ROI is represented as a heat map. The scale indicates lowest z-score (-3) in dark blue to highest z-score (3) in dark red. The lipids with coordinated spatio-temporal distribution were clustered together based on the unsupervised pattern recognition analysis using HCA. ROIs are grouped according to the following brain divisions: Telencephalon (A), Diencephalon (B), Brain stem (C), Cerebellum (D) and Fiber Tracts (E). OA, olfactory area; ST, striatum; vST, ventral striatum; CTX, cortex; HIP, hippocampus; TH, thalamus; HYP, hypothalamus; MB, midbrain; HB, hindbrain; CBX, cerebellum; AV, arbor vitae; CC, corpus callosum; FO, fornix.

Similar articles

Cited by

References

    1. Montesinos J, Guardia-Laguarta C, Area-Gomez E. The fat brain. Curr Opin Clin Nutr Metab Care. (2020) 23:68–75. 10.1097/MCO.0000000000000634 - DOI - PubMed
    1. O'Brien JS, Sampson EL. Lipid composition of the normal human brain: gray matter, white matter, and myelin. J Lipid Res. (1965) 6:537–44. 10.1016/S0022-2275(20)39619-X - DOI - PubMed
    1. Hussain G, Wang J, Rasul A, Anwar H, Imran A, Qasim M, et al. . Role of cholesterol and sphingolipids in brain development and neurological diseases. Lipids Health Dis. (2019) 18:26. 10.1186/s12944-019-0965-z - DOI - PMC - PubMed
    1. Borroni MV, Valles AS, Barrantes FJ. The lipid habitats of neurotransmitter receptors in brain. Biochim Biophys Acta. (2016) 1858:2662–70. 10.1016/j.bbamem.2016.07.005 - DOI - PubMed
    1. Poitelon Y, Kopec AM, Belin S. Myelin fat facts: an overview of lipids and fatty acid metabolism. Cells. (2020) 9:812. 10.3390/cells9040812 - DOI - PMC - PubMed

LinkOut - more resources