. 2022 Jul 28:9:932937.
doi: 10.3389/fnut.2022.932937. eCollection 2022.

Dynamics and determinants of human plasma bile acid profiles during dietary challenges

Affiliations

Dynamics and determinants of human plasma bile acid profiles during dietary challenges

Jarlei Fiamoncini et al. Front Nutr. .

Abstract

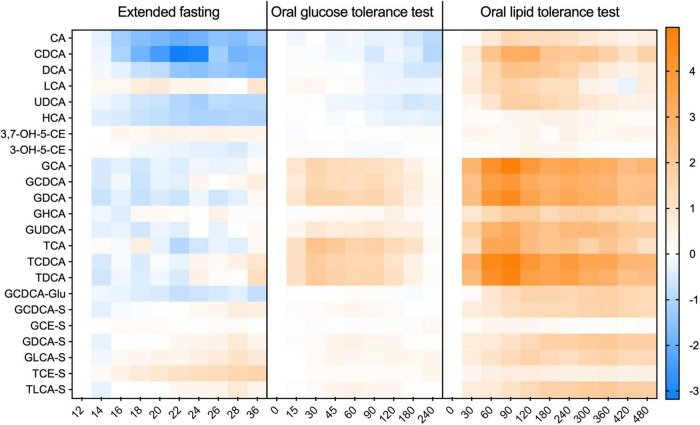
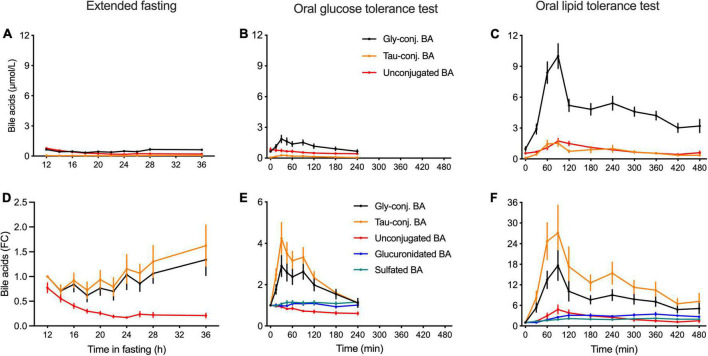
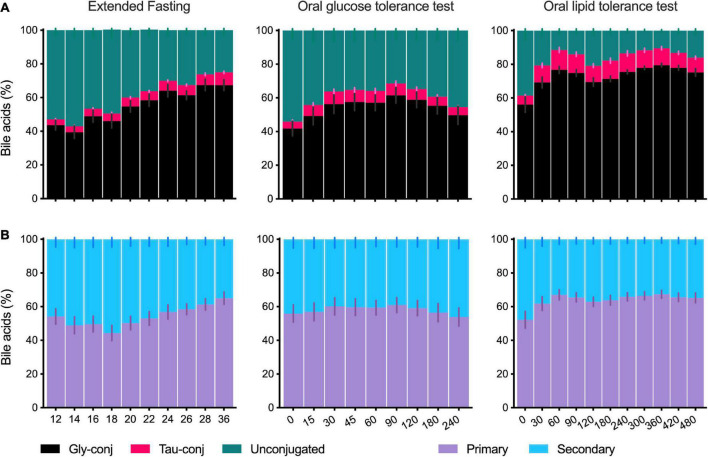
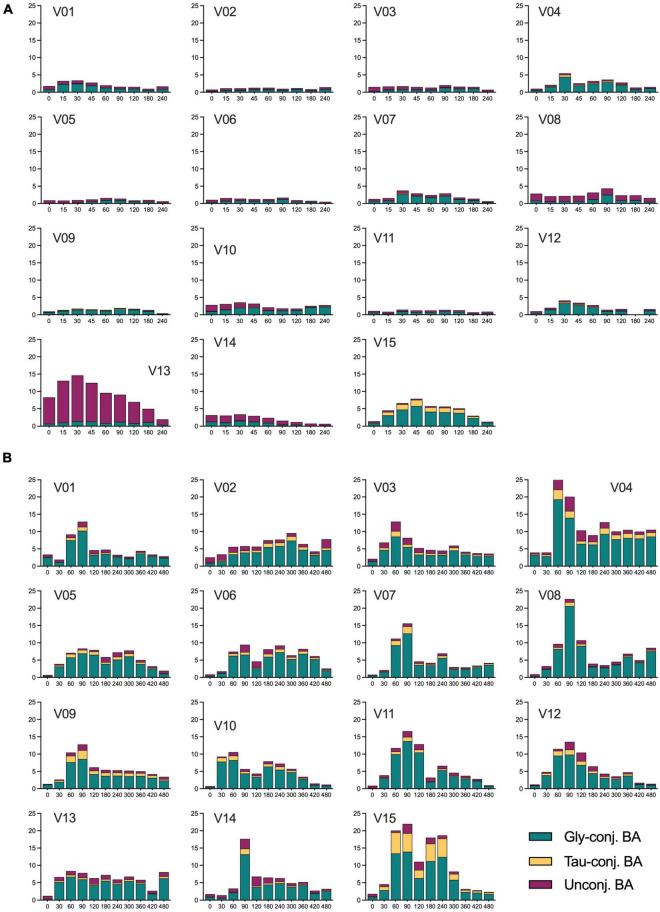
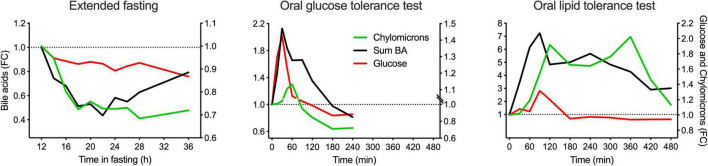
In recent years, bile acids (BA) have received great interest due to their pleiotropic biological activity and the presence of plasma membrane-bound and nuclear receptors. Moreover, BA in blood have been identified by metabolite screening approaches as biomarkers that are associated with various diseases and even with a human longevity phenotype. With the growing interest in the microbiota contribution to the health-disease trajectory, BA that undergo deconjugation and other modifications by bacteria in the large intestine have become a prime target as a microbiome diversity modifier. We here profiled BA by a quantitative and a semiquantitative approach in 15 healthy and phenotypically very similar young individuals for over a 36-h fasting period, an oral glucose tolerance test (OGTT), and an oral lipid tolerance test (OLTT). We demonstrate a remarkable heterogeneity of the responses and describe the different dynamics of the plasma changes that likely originate from different routes by which BA enters the peripheral blood, and that may represent a direct secretion from the liver into the blood and a route that reaches the blood as a spill-over after passing from the gallbladder through the intestine and the portal system. We discuss the finding that an individual transport process involved in the passage of BA could be a critical determinant in the kinetics of plasma appearance and the overall phenotypic variability found.

Keywords: OGTT; OLTT; bile salts; fasting; postprandial.


Conflict of interest statement

The authors declare that the research was conducted in the absence of any commercial or financial relationships that could be construed as a potential conflict of interest.

Figures

FIGURE 1
FIGURE 1
Kinetic profiles of individual bile acids in plasma during the extended fasting and dietary challenges. The appearance of individual BA species in each challenge expressed as a fold-change from the baseline. Data was Log-2 normalized and presented as mean ± SEM. N = 15 with the X-axis given in minutes.
FIGURE 2
FIGURE 2
Kinetics of classes of bile acids in plasma in the postprandial state and during the extended fasting period. (A–C) Plasma concentration of BA displayed as the sums of unconjugated, glycine and taurine-conjugated BA is expressed as nmol/L. (D–F) Appearances of unconjugated, glycine- and taurine-conjugated BA as well as sulfated and glucuronidated BA species are expressed as the fold-change from the baseline. (A,D) Samples from the extended fasting period. (B,E) Samples from the OGTT. (C,F) Samples from the OLTT. Data presented as mean ± SEM (N = 15).
FIGURE 3
FIGURE 3
Composition of the plasma bile acid profile in the postprandial state and during the extended fasting. (A) Percentage of the sums of unconjugated, glycine- and taurine-conjugated BA in the total profile as collected during the extended fasting, OGTT and OLTT. (B) Percentage of the sums of primary and secondary BA in the plasma BA profile collected during the extended fasting, OGTT and OLTT. Data presented as mean ± SEM (N = 15). The X-axis for fasting is given in hours and the X-axis for OGTT and OLTT is in minutes.
FIGURE 4
FIGURE 4
Concentration of unconjugated, glycine- and taurine-conjugated BA in plasma samples of all subjects during the OGTT and OLTT. (A) Concentrations of the three classes of BA in each individual during the OGTT. (B) Concentrations of the three classes of BA in every subject during the OLTT. V01, V02… V15 refer to individual study subjects. The concentration of the BA classes is expressed as μmol/L with the X-axis given in minutes.
FIGURE 5
FIGURE 5
Comparison of the kinetic behaviors of BA (total), glucose, and chylomicrons in plasma in the postprandial state and during the extended fasting period. Plasma concentration of the sum of all BA quantified is represented in the left Y-axis, whereas plasma concentration of chylomicrons and glucose are represented in the right Y-axis. Data are expressed as the fold-change relative to the baseline and presented as mean ± SEM (N = 15).

Similar articles

Cited by

References

    1. Guzior DV, Quinn RA. Review: microbial transformations of human bile acids. Microbiome. (2021) 9:140. 10.1186/s40168-021-01101-1 - DOI - PMC - PubMed
    1. Ridlon JM, Harris SC, Bhowmik S, Kang DJ, Hylemon PB. Consequences of bile salt biotransformations by intestinal bacteria. Gut Microbes. (2016) 7:22–39. 10.1080/19490976.2015.1127483 - DOI - PMC - PubMed
    1. Gregorio MC, Cautela J, Galantini L. Physiology and physical chemistry of bile acids. Int. J. Mol. Sci. (2021) 22:1780. 10.3390/ijms22041780 - DOI - PMC - PubMed
    1. Fiorucci S, Distrutti E, Carino A, Zampella A, Biagioli M. Bile acids and their receptors in metabolic disorders. Prog Lipid Res. (2021) 82:101094. 10.1016/j.plipres.2021.101094 - DOI - PubMed
    1. Perino A, Demagny H, Velazquez-Villegas L, Schoonjans K. Molecular physiology of bile acid signaling in health, disease, and aging. Physiol Rev. (2021) 101:683–731. 10.1152/physrev.00049.2019 - DOI - PubMed

LinkOut - more resources